A couple weeks ago, Microsoft Research made available a project that had been under development for a while called Debugger Canvas. This is a visual tool for debugging applications where your functions appear as bubbles, similar to a database diagram or UML diagram. It only works on Visual Studio 2010 Ultimate due to the fact that it uses some internal features that are only included in the Ultimate edition.
Because Debugger Canvas is a project of Microsoft Research, it's not "official" in that it's not actually a part of Visual Studio, nor is it an official, supported Microsoft product. And it contains bugs. It's the culmination of research and development, and is a prototype of sorts. It's buggy, and it doesn't quite do everything you might want. But nevertheless, it's pretty cool and you'll want to try it out. (And there's a good possibility it'll be part of a future version of Visual Studio. Several projects in Microsoft Research have become actual, official Microsoft products. Perhaps the biggest one right now is the Kinect.)
Normally when I do a product review, I try to give about 3-5 screen shots, because more than that gets a little cumbersome. But this time I'm going to break that rule, and instead go with the old saying that a picture is worth a thousand words.
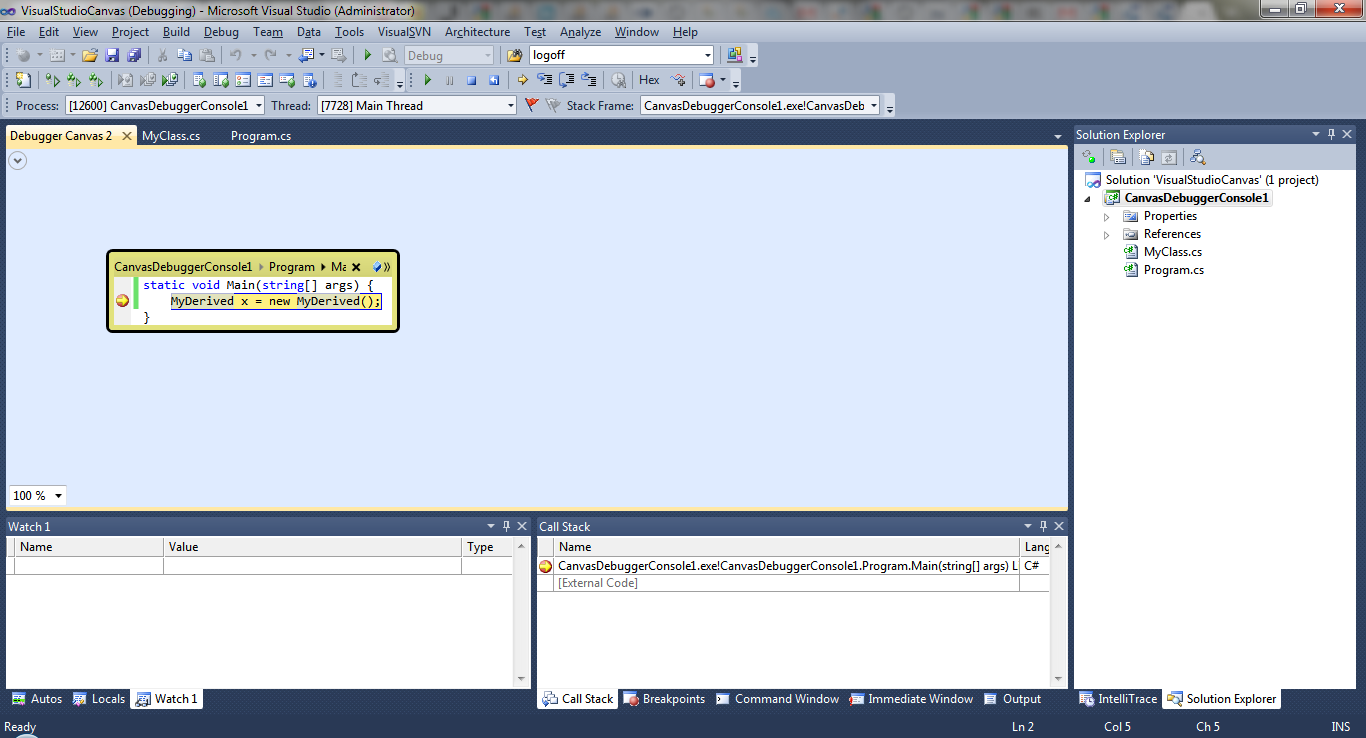
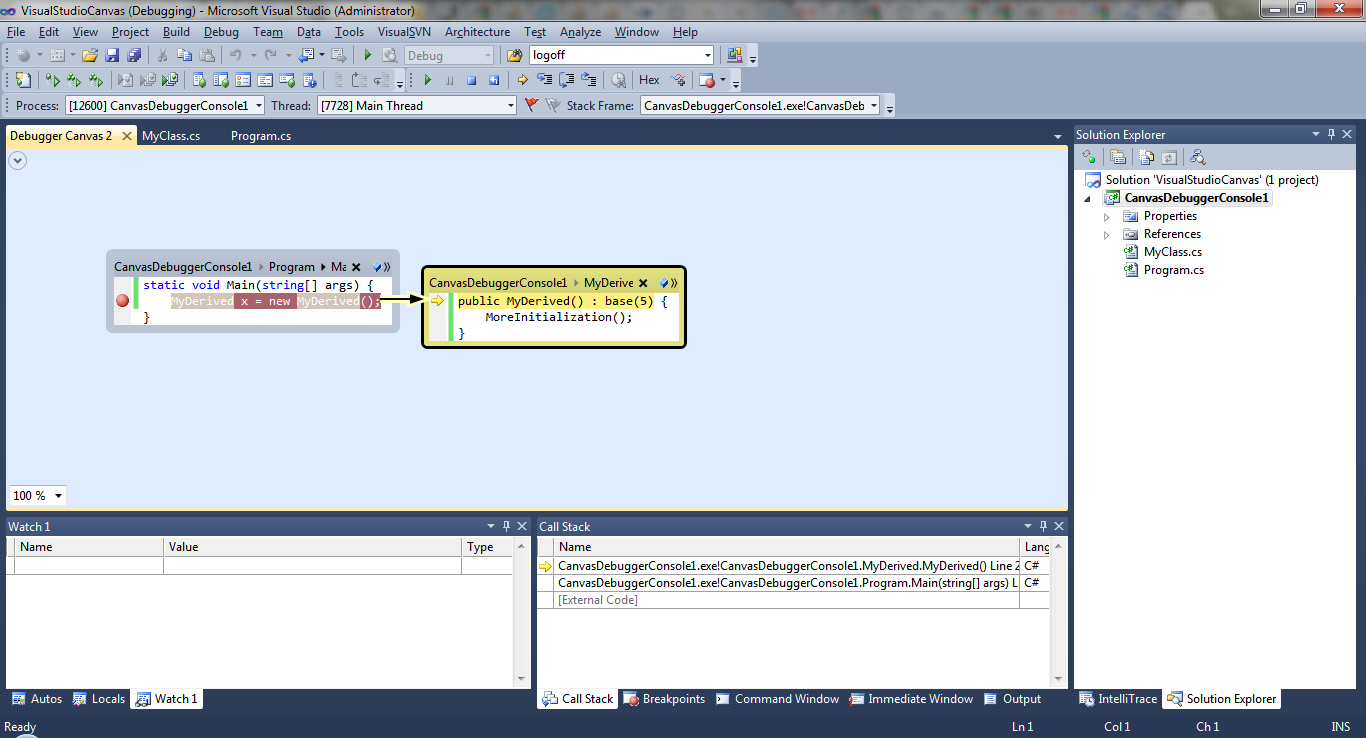
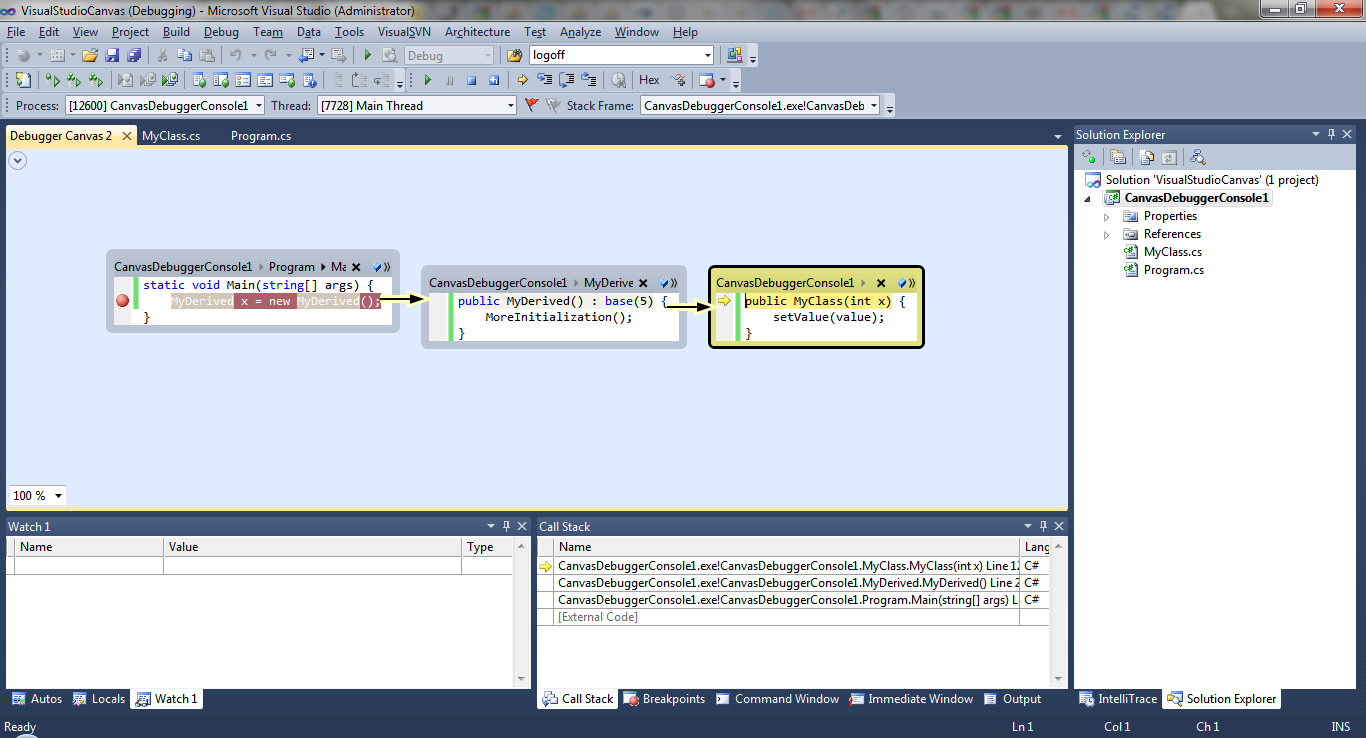
To get going, I created a short console program with a class, a derived class, and a main that creates an instance of the derived class. I set a break point in the main and started debugging. But instead of the usual debugger kicking in, a new canvas tab opened up, and it looked like this:
You can see the code bubble in the canvas. The bubble contains the code for the Main function. And interestingly, the inside of this bubble is an instance of the usual Visual Studio code editor. You can right-click on the code and see the same popup menu you normally see in the debugger, along with a few extra menu items for the Debugger Canvas.
Now when you press F11 to step into the next function, you get another code bubble like so:
Press F11 yet again, and you get yet another code bubble:
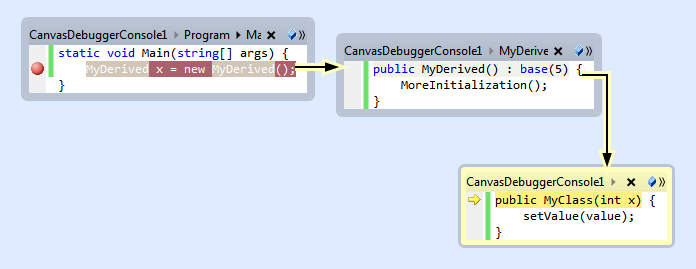
Now I quickly found that I was running out of room on my screen, but I can drag the code bubbles around. I moved the right-most one down, and it looked like this:
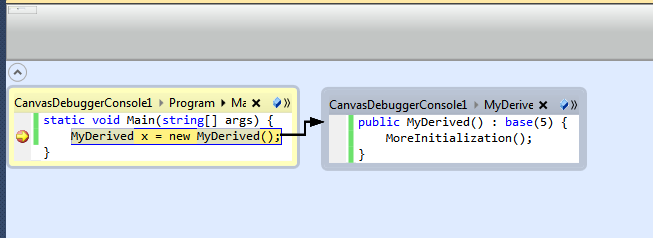
Oddly, there are no scrollbars in the canvas. I'm not sure why they didn't include those. But up at the top left is a little v-shape icon in a circle. If you click this, you see a thumbnail view of the entire canvas, including the areas that aren't visible. There's a little rectangle representing where you are in the canvas, and you can drag that rectangle around to move the view. It's hard to describe in writing, but this is what it looks like:
The thumbnail view isn't the best, but you can more-or-less make out what's what enough to move the view around. And there's also a zoom dropdown in the lower-left that you can use for zooming in and out at a set of predefined zooms (20%, 50%, 70%, 100%, 150%, 200%, 400%).
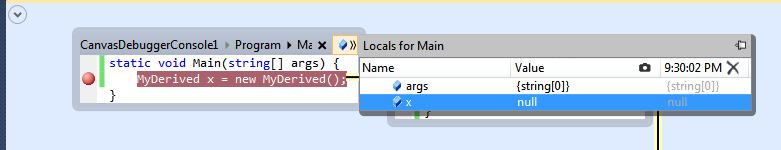
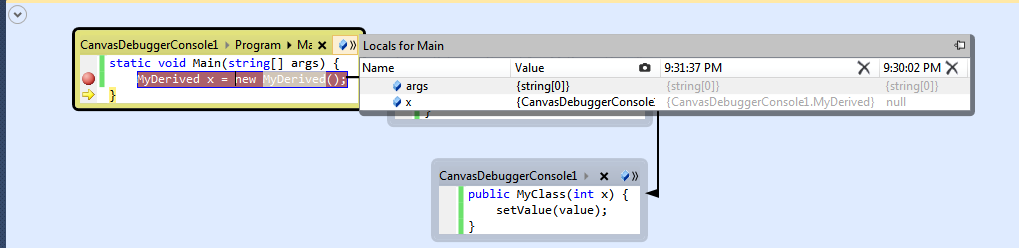
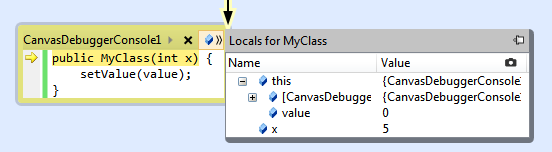
But you can do much more than just look at your code in bubbles. You can inspect all the local variables by clicking the little icon in the upper-right corner of the code bubble. Here I am showing the locals for the third function's bubble:
Although the locals bubble looks identical to the usual Locals Window, I was a bit disappointed that I couldn't change the values like I can in the Locals Window. Maybe they'll add that capability later.
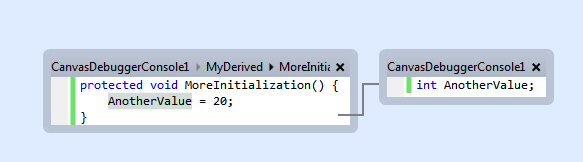
Other features of the IDE are integrated into Debugger Canvas. For example, if you right-click on an identifier in one of the code bubbles and click Go To Definition, a new code bubble will open displaying the definition, which is usually either a function or a single line of code in the case of a member variable like so:
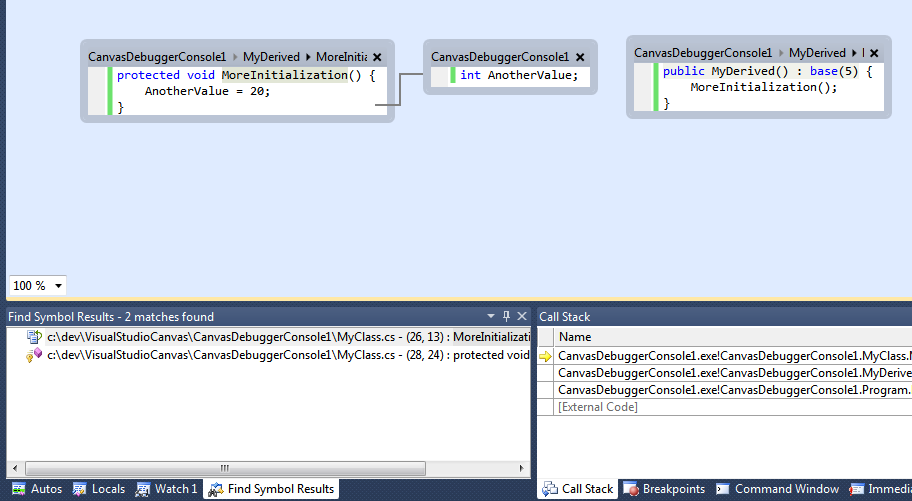
Back to the right-click menu, you can also click Find All References. This behaves similar to before in that you get a list of results in a separate pane. But now if you click on one of those results, a new bubble opens up in the canvas containing the function you clicked on:
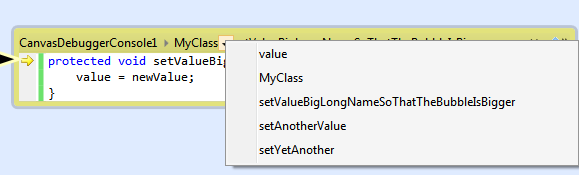
Another interesting feature is that the top of each bubble shows the namespace, class name, and function name of the function inside the bubble. Between each name is a triangle. If you click the triangle you get a popup listing the different members. For example, if your bubble contains a member function of the class MyClass, you can click the triangle to the right of MyClass and you'll see all of MyClass's members. You can then click one and get a new bubble. Here's an example:
But there was a slight problem: If the code isn't very wide, the title bar containing the class name and function name gets cut off, and the triangle is hidden. The only way I could get to the triangle was to make the code "wider". I did that by MakingTheFunctionNameReallyLong:
protected void setValueBigLongNameSoThatTheBubbleIsBigger(int newValue) {
    value = newValue;
}
Of course, that's not acceptable. But for some reason I couldn't resize the bubbles either, even though the edges look like they can be moved. Perhaps that's a bug and you're supposed to be able to resize the bubbles. Hopefully it's something they'll fix.More Canvases
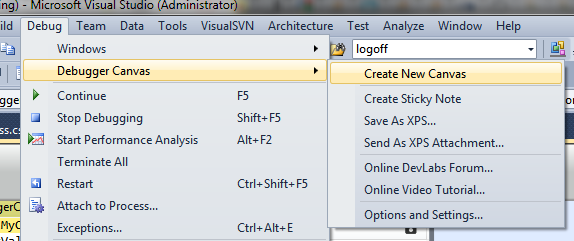
In the menu bar, the Debug menu now has a Debugger Canvas submenu with several menu items:
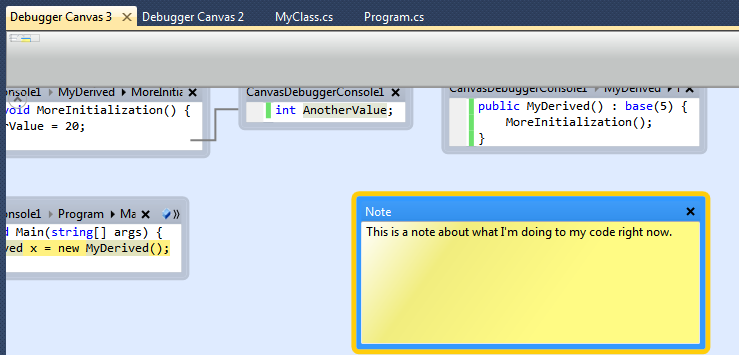
The first one lets you create another canvas. Each canvas opens in a tab in the editor, and each one operates independently. For example, if you open a bubble for a particular function in one canvas, and then a bubble in another canvas for the same function, and you set a breakpoint in that function, both bubbles will be active when you reach that breakpoint.Snapshots
Another interesting feature is the ability to take snapshots of your local variables. Click the little camera icon and the values will all get saved, as I did here:
Then later I returned from the call, and the values changed. I took another snapshot and you can see both of them side by side:
Unfortunately, the "value" in the case of an object isn't actually present; instead, just the object's type. Normally in the debugger when you're inspecting values you can drill into the object and see the members. But the snapshot apparently doesn't save that information. Again, maybe that's a feature they'll add later.Sticky Notes
Another feature is the ability to drop sticky notes on your canvases, and fill in some text:
Apparently the idea here is that you can then share these canvases with other members of your development team. The way you do that is save the canvases to a file (with a .xps filename). You can then email this file to somebody, and they can then open it in… in what? Well, .xps is Microsoft's own printable file format similar to PDF. And all the new versions of Windows come with an XPS viewer that's similar to Adobe Reader. So you can open the .xps files in this viewer, and from there just look at them or print them.After The Debugging
Interestingly, after you stop debugging and Visual Studio returns to edit mode, the canvas files are still open in the editor. And you can still mess with them. You can right-click something and click Go To Definition, and a new bubble will open, and so on. That means you can use this tool even when you're not debugging if you want a visual concept of your program.
So if these canvases stay open, will they even persist between sessions? I wasn't sure, so I tried it. And unfortunately, the answer is No. I was especially wondering considering the Save feature saves them as a read-only XPS file, rather than some sort of "canvas file" that you can continue using later on. Again, that would be a nice feature to include where you can open your canvases up between sessions and send them to other people rather than just an image of them in a .xps file.
IntelliTrace Integration
There's one more feature I want to mention: IntelliTrace integration. Debugger Canvas is fully integrated with Visual Studio's IntelliTrace feature. The best way to explore this is by just trying it out, or watching a video of it in action. Microsoft has put up just such a video. This video explores many of the features, and towards the end is an IntelliTrace demonstration. Find it here . Have a look at it; it'll do it more justice then I'd be able to do just in a few paragraphs and screen captures.
Summary
All in all, this is pretty cool. I'm definitely going to use it for a while in my own projects and see if it works out for me. My first impression is a definite thumbs up. Like most things, however, I'll have to spend a few months using it and see if it really does become a regular part of my development, or if it'll just remain sort of a novelty that I eventually remove. If you're a Visual Studio developer and you have VS 2010 Ultimate installed, try it out and see what you think. And if you have thoughts you want to share with other DaniWeb members, post some replies here. But if you have suggestions for the product, head over to Microsoft's forums where the people involved in the project will be reading your feedback. You can find the forums here .