954,173 Members — Technology Publication meets Social Media
Username:
Password:
Lost login information?
Have something to say? Contribute New Article Reply to this Article

Triangular distribution

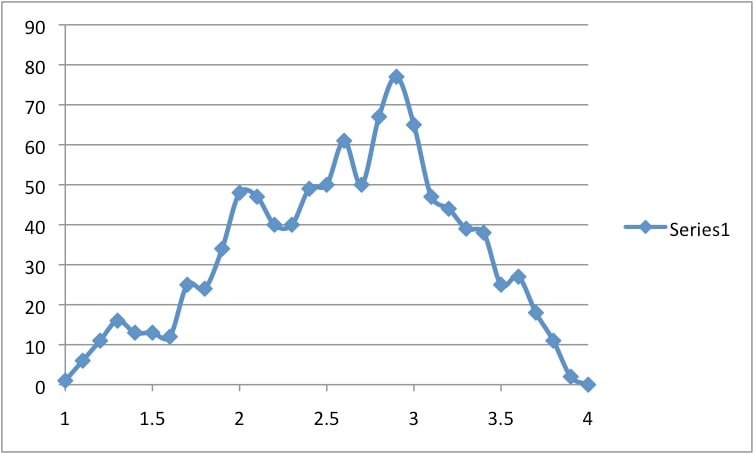
I'd like to write up something that will generate random numbers that would plot into a triangle distribution. I know how to get a normal distribution, which is similar.

import random

for i in range(200):
  print random.normalvariate(3,1)


But there doesn't seem to be anything in the random module about triangle distribution. Does anyone know of a way to do it?

mn_kthompson
Junior Poster
148 posts since Nov 2007
Reputation Points: 16
Solved Threads: 35
 

I think you could write your own function like this

from random import random
from math import sqrt

def triangular(a, c, b):
  c = float(c)
  t = (c-a)/(b-a)
  y = sqrt(random())
  d = a if random() < t else b
  return d + (c-d) * y

if __name__ == "__main__":
  for i in range(100):
    print(triangular(1, 3, 4))

Explanation: I start from the density function in the wikipedia page http://en.wikipedia.org/wiki/Triangular_distribution . Obviously, if a random variable Z has this distribution, the probability that it's between a and c is t=(c-a)/(b-a). So I first choose if the variable must be between a and c or between c and b by comparing a uniformly random number in [0,1] to this value. Then I choose a first Y which is the square root of a uniformly random number between 0 and 1. Such a variable has a linear density function f(t) = 2 t in (0, 1]. This is easy to compute. Then I rescale this variable so that it falls between [a, c] or [c, b].
There is some work if you want to convince yourself that it works, but I'm rather good at math, so it should :)

Gribouillis
Posting Maven
Moderator
2,781 posts since Jul 2008
Reputation Points: 1,024
Solved Threads: 691
 
Obviously, if a random variable Z has this distribution, the probability that it's between a and c is t=(c-a)/(b-a).

Oh yeah, that's totally obvious. I'm not exactly bad at math, but I never would have derived that from the probability density formula given. I thought I would have to take in my random number, test if the random number was between a and c or if it was between c and b. It looks like you're doing that on lines 6 and 8, but I don't understand it. I'll call that the magic part. Then I figured I would apply that 2(x-a)/(b-a)(c-a) formula that was given. I never would have thought about rescaling it back.

Then I said "Aw hell, maybe there's a built in way to do it."

mn_kthompson
Junior Poster
148 posts since Nov 2007
Reputation Points: 16
Solved Threads: 35
 

By the way, I ran your function 1000 times with a lower bound of 1, an upper bound of 4 and a most likely number of 3. I then plotted the number in Excel and have attached the graph. It is quite triangular.

Attachments triangle.jpg 51.5KB
mn_kthompson
Junior Poster
148 posts since Nov 2007
Reputation Points: 16
Solved Threads: 35
 

This question has already been solved

Post: Markdown Syntax: Formatting Help
You