
A simple physics graph...
import pylab
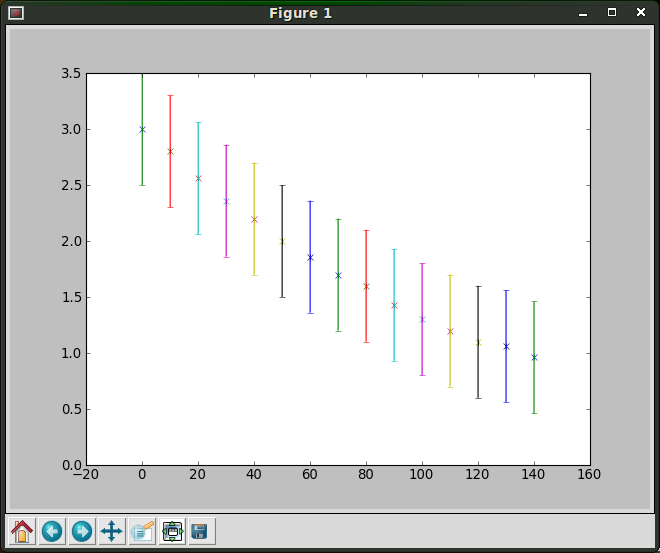
a_time = range(0,141,10)
a_R = [3.0,2.8,2.56,2.36,2.2,2.0,1.86,1.7,1.6,1.43,1.3,1.2,1.1,1.06,0.96]
for i in range(0,15):
pylab.plot(a_time[i],a_R[i], 'x')
pylab.errorbar(a_time[i], a_R[i], 0.5, 0.05)
pylab.show()I'm guessing the pylab.plot line isn't needed, but even with this there is nothing connecting the plots together. I'm pretty sure there wasn't anything extra needed when i tried this out on another machine.
Here's an image: http://i51.tinypic.com/v77gjb.jpg or check the attachment
EDIT: Oh and i'm running Ubuntu 9.10 with matplotlib installed through the software centre
So basically what I want is a line joining the plots, either i'm being really stupid or there are some settings I need to change...