Hi,

i have a dataset with 2 columns. 1 column is in String datatype and another one is in Timespan.
Now i want to generate a chart from the dataset.

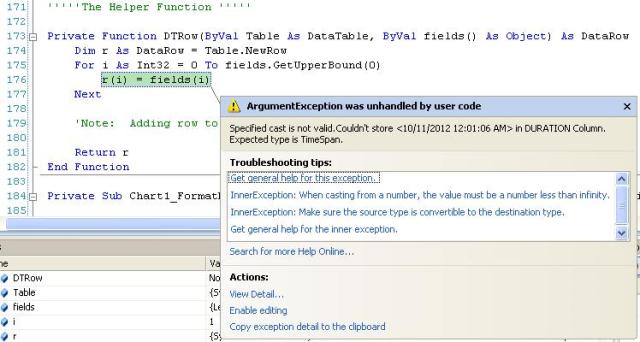
While i'm trying to generate the chart, it has error:
"Series data points do not support values of type System.TimeSpan only values of these types can be used: Double, Decimal, Single, int, long, uint, ulong, String, DateTime, short, ushort. "

Do I need to convert my timespan column to another type first?
Can someone help me how to solve this error?

Recommended Answers

All 20 Replies

Have you tried to cast it to the data type of Date?

You want to generate chart in DataBase directly? Or is it ok to export data to Excel and then generate chart? h

If the later, you can use Data Export component to export data to Excel and generate chart when exporting.

@Beginnerdave :: If i cast it to date, is it possible to generate the bar chart? I want the output to be something like this:

Hi Lee.L,

Currently, I want to create a website that can monitor the total duration for each process.

Now I get the data from database and store it inside dataset. So from the dataset, I want it to generate a chart inside my website.

Hi lulu:

The following example is for a WinForm, but I believe the charting control works the same for the a Web app.

You need to first convert the Timespan to a datetime value to chart it, but I guess you already discovered that. ;)

The problem then becomes one of formatting the Y-axis. Not too hard, but it can be confusing. Give this a try on a new WinForm project to which you have added a single chart control to the form.

Imports System.Windows.Forms.DataVisualization.Charting
Public Class Form1

Private Sub Form1_Load(ByVal sender As System.Object, ByVal e As System.EventArgs) Handles MyBase.Load

   ' Make some data
   Dim dt As New DataTable
   Dim r As DataRow
   With dt
      .Columns.Add("Label", GetType(String))
      .Columns.Add("TS", GetType(TimeSpan))
      r = .NewRow : r(0) = "A1" : r(1) = TimeSpan.Parse("0.00:45:00") : .Rows.Add(r)
      r = .NewRow : r(0) = "A2" : r(1) = TimeSpan.Parse("1.01:00:00") : .Rows.Add(r)
      r = .NewRow : r(0) = "A3" : r(1) = TimeSpan.Parse("0.06:00:00") : .Rows.Add(r)
      r = .NewRow : r(0) = "A4" : r(1) = TimeSpan.Parse("0.12:45:00") : .Rows.Add(r)

   End With

   ' Add a DateTime Column
   dt.Columns.Add("ChartTime", GetType(DateTime))


   ' Now for the real work!

   ' I use "Today" as the base date.  In a perfect world we could do:
      'For Each r In dt.Rows
      '   r("ChartTIME") = New DateTime(CType(r("TS"), TimeSpan).Ticks)
      'Next
   ' but the chart control uses OLE Automation dates and they use a 
   ' different time basis than .Net Dates.

   ' set a temp Today to prevent the unlikely case the the day changes while executing
   Dim myToday As DateTime = Today
   For Each r In dt.Rows
      ' Add the HH:mm:ss to the base date and save it
      r("ChartTIME") = myToday.Add(CType(r("TS"), TimeSpan))
   Next

   ' Setup the chart

   With Chart1
      .Dock = DockStyle.Fill
      .DataSource = dt
      .Legends.Clear()
      .ChartAreas.Clear()
      .ChartAreas.Add(New ChartArea("Fred"))
      With .ChartAreas("Fred")
         .AxisY.Minimum = myToday.ToOADate
         .AxisY.Maximum = Math.Ceiling(CDate(dt.Compute("Max([ChartTime])", "True")).ToOADate)

         .AxisY.LabelStyle.Format = "HH:mm:ss"

      'Play with this to get the effect you want
         .AxisY.LabelStyle.IntervalType = DateTimeIntervalType.Hours
         .AxisY.LabelStyle.Interval = 2 'hours

         .AxisX.LabelStyle.Format = "G"
         .AxisX.LabelStyle.Interval = 0
         .AxisX.LabelStyle.IntervalType = DateTimeIntervalType.Auto
      End With
      .Series.Clear()
      .Series.Add(New Series("Wilma"))

      With .Series("Wilma")
         .ChartArea = "Fred"
         .ChartType = SeriesChartType.Column
         .XValueType = ChartValueType.String
         .XValueMember = "Label"

         .YValueType = ChartValueType.DateTime
         .YValueMembers = "ChartTime"

      End With

   End With
End Sub

End Class

If this is a continuation of your ealier thread: http://www.daniweb.com/software-development/vbnet/threads/434861/how-to-group-and-sum-datatable, I can help you modify the LINQ to produce the DateTime value directly if that would make sense.

Dear TnTimNM, here is my code for your reference :)

But please take note that i've got an error while trying to converting the timespan column to datetime in the new column that i added.

Imports System.Data
Imports Oracle.DataAccess.Client ' ODP.NET Oracle managed provider
Imports Oracle.DataAccess.Types
Imports System.Web.UI.DataVisualization.Charting

Imports System.Linq

Partial Public Class WebForm1

    Inherits System.Web.UI.Page


    Protected Sub Page_Load(ByVal sender As Object, ByVal e As System.EventArgs) Handles Me.Load
        Dim li As ListItem


        For Each li In DDL1.Items()
            If li.Selected = True Then
                If Len(Trim(strLine)) <> 0 Then
                    strLine = strLine & "','" & li.Text
                Else
                    strLine = li.Text
                End If
            End If
        Next


    End Sub

    Protected Sub Button1_Click(ByVal sender As Object, ByVal e As EventArgs) Handles Button1.Click
        Dim oradb As String = "Data Source=XXXX;User Id=XXXX;Password=XXXX;"
        Dim conn As New OracleConnection(oradb)
        Dim cmd As New OracleCommand
        Dim myDataAdapter As New OracleDataAdapter
        Dim mySelect As String


        Try

            conn.Open()

            mySelect = "SELECT REFLINKTBL.LINENAME, JSFACTOR.EVENTTM  "
            mySelect = mySelect & " FROM (SELECT JSLINE.LINENAME, JSMC.RECID, JSMC.MCNAME, JSMC.GOH "
            mySelect = mySelect & " FROM JSLINE RIGHT OUTER JOIN  "
            mySelect = mySelect & " JSMC ON JSLINE.RECID = JSMC.ID_JSLINE) REFLINKTBL INNER JOIN  "
            mySelect = mySelect & " JSFACTOR ON JSFACTOR.ID_JSMC = REFLINKTBL.RECID  "
            mySelect = mySelect & " WHERE JSFACTOR.YOUIN LIKE '%CSTTRB%'  "
            mySelect = mySelect & " AND (JSFACTOR.EVENTST BETWEEN '2012/08/06 00:00:00' AND '2012/08/12 00:00:00') "
            mySelect = mySelect & " AND LINENAME IN ('" & strLine & "')  "
            mySelect = mySelect & " ORDER BY LINENAME, JSFACTOR.EVENTST "

            myDataAdapter = New OracleDataAdapter(mySelect, conn)


            Dim Ds As New DataSet()

            myDataAdapter.Fill(Ds)

            'Create a new Table to hold the results

            Dim grpDT As DataTable = Ds.Tables(0).Clone 'Copy structure of original Table
            'Make the changes to the Table structure. 
            grpDT.Columns("EVENTTM").DataType = GetType(TimeSpan)
            grpDT.Columns("EVENTTM").ColumnName = "DURATION"


            'This LINQ use a helper function (DTRow) to create the DataRow
            Dim group As IEnumerable(Of DataRow) = _
                From row In Ds.Tables(0).AsEnumerable() _
                    Group row By LINENAME = row.Field(Of String)("LINENAME") Into grp = Group _
                    Order By LINENAME _
                    Select DTRow(grpDT, _
                                 New Object() {LINENAME, _
                                               New TimeSpan( _
                                                grp.Sum(Function(r2 As DataRow) TimeSpan.Parse(r2.Field(Of String)("EVENTTM")).Ticks _
                                                            ) _
                                                          ) _
                                                         } _
                                                        )

            'Add the query results to the new Table

            For Each row As DataRow In group
                grpDT.Rows.Add(row)
            Next

            ''''Add new column to store Duration value in Datetime format '''

            Dim dc1 As DataColumn

            dc1 = New DataColumn("datanew", GetType(DateTime))

            grpDT.Columns.Add(dc1)

            Dim datanew As DataColumn = grpDT.Columns(2)
            Dim time As New DateTime

            For i As Integer = 0 To grpDT.Rows.Count - 1
                time = grpDT.Rows(i).Item("DURATION").ToString()
                grpDT.Rows(i).Item(datanew) = time.ToShortTimeString()
            Next


            GridView1.DataSource = grpDT
            GridView1.DataBind()

        Catch ex As OracleException

            MsgBox("Error: " & ex.ToString())


        End Try

    End Sub

    '''''The Helper Function '''''

    Private Function DTRow(ByVal Table As DataTable, ByVal fields() As Object) As DataRow
        Dim r As DataRow = Table.NewRow
        For i As Int32 = 0 To fields.GetUpperBound(0)
            r(i) = fields(i)
        Next

        'Note:  Adding row to Table does not work with this function called by LINQ

        Return r
    End Function


End Class

Dear TnTimNM,

Now I am able to create the chart without any error! thanks to ur support! Really happy today (^___^)

But may I ask you about two things?

First, regarding the timespan. From the result that i get, total sum that is more than 24 hours will be converted to 1 day, for example: 1.03:04:49.
How can I change the day to 24 hours like 1.03:04:49 will become 27:04:49. Is it possible to do like that?

Second, how can i set the Y-Axis to become larger so that the total hour can see clearly?

Anyway, here is the code and the sample output of the chart:

Imports System.Data
Imports Oracle.DataAccess.Client ' ODP.NET Oracle managed provider
Imports Oracle.DataAccess.Types
Imports System.Web.UI.DataVisualization.Charting
Imports System.Linq

Public Partial Class ChartQ

    Inherits System.Web.UI.Page


    Protected Sub Page_Load(ByVal sender As Object, ByVal e As System.EventArgs) Handles Me.Load
        Dim li As ListItem


        For Each li In DDL1.Items()
            If li.Selected = True Then
                If Len(Trim(strLine)) <> 0 Then
                    strLine = strLine & "','" & li.Text
                Else
                    strLine = li.Text
                End If
            End If
        Next


    End Sub

    Protected Sub Button1_Click(ByVal sender As Object, ByVal e As EventArgs) Handles Button1.Click
        Dim oradb As String = "Data Source=XXXX;User Id=XXXX;Password=XXXX;"
        Dim conn As New OracleConnection(oradb)
        Dim cmd As New OracleCommand
        Dim myDataAdapter As New OracleDataAdapter
        Dim mySelect As String


        Try

            conn.Open()

            mySelect = "SELECT REFLINKTBL.LINENAME, JSFACTOR.EVENTTM  "
            mySelect = mySelect & " FROM (SELECT JSLINE.LINENAME, JSMC.RECID, JSMC.MCNAME, JSMC.GOH "
            mySelect = mySelect & " FROM JSLINE RIGHT OUTER JOIN  "
            mySelect = mySelect & " JSMC ON JSLINE.RECID = JSMC.ID_JSLINE) REFLINKTBL INNER JOIN  "
            mySelect = mySelect & " JSFACTOR ON JSFACTOR.ID_JSMC = REFLINKTBL.RECID  "
            mySelect = mySelect & " WHERE JSFACTOR.YOUIN LIKE '%CSTTRB%'  "
            mySelect = mySelect & " AND (JSFACTOR.EVENTST BETWEEN '2012/08/06 00:00:00' AND '2012/08/12 00:00:00') "
            mySelect = mySelect & " AND LINENAME IN ('" & strLine & "')  "
            mySelect = mySelect & " ORDER BY LINENAME, JSFACTOR.EVENTST "

            myDataAdapter = New OracleDataAdapter(mySelect, conn)


            Dim Ds As New DataSet()

            myDataAdapter.Fill(Ds)

            'Create a new Table to hold the results

            Dim grpDT As DataTable = Ds.Tables(0).Clone 'Copy structure of original Table
            'Make the changes you indicated to the Table structure.  You can do this as long as the table is empty.
            grpDT.Columns("EVENTTM").DataType = GetType(TimeSpan)
            grpDT.Columns("EVENTTM").ColumnName = "DURATION"

            'Now the LINQ
            'This LINQ use a helper function (DTRow) to create the DataRow
            Dim group As IEnumerable(Of DataRow) = _
                From row In Ds.Tables(0).AsEnumerable() _
                    Group row By LINENAME = row.Field(Of String)("LINENAME") Into grp = Group _
                    Order By LINENAME _
                    Select DTRow(grpDT, _
                                 New Object() {LINENAME, _
                                               New TimeSpan( _
                                                grp.Sum(Function(r2 As DataRow) TimeSpan.Parse(r2.Field(Of String)("EVENTTM")).Ticks _
                                                            ) _
                                                          ) _
                                                         } _
                                                        )

            'Add the query results to the new Table

            For Each row As DataRow In group
                grpDT.Rows.Add(row)
            Next
            GridView1.DataSource = grpDT
            GridView1.DataBind()

            ''''Add new column '''

            grpDT.Columns.Add("ChartTime", GetType(DateTime))

            Dim myToday As DateTime = Today
            For Each r In grpDT.Rows
                r("ChartTime") = myToday.Add(CType(r("DURATION"), TimeSpan))
            Next


            ' Setup the chart
            With Chart1
                .DataSource = grpDT
                .Legends.Clear()
                .ChartAreas.Clear()
                .ChartAreas.Add(New ChartArea("Fred"))
                With .ChartAreas("Fred")
                    .AxisY.Minimum = myToday.ToOADate
                    .AxisY.Maximum = Math.Ceiling(CDate(grpDT.Compute("Max([ChartTime])", "True")).ToOADate)
                    .AxisY.LabelStyle.Format = "HH:mm:ss"


                    'Play with this to get the effect you want
                    .AxisX.LabelStyle.Interval = 1
                    .AxisY.LabelStyle.IntervalType = DateTimeIntervalType.Hours
                    .AxisY.LabelStyle.Interval = 1 'hours         
                    .AxisX.LabelStyle.Format = "G"
                    '  .AxisX.LabelStyle.Interval = 0
                    .AxisX.LabelStyle.IntervalType = DateTimeIntervalType.Auto
                End With

                .Series.Clear()
                .Series.Add(New Series("Wilma"))

                With .Series("Wilma")
                    .ChartArea = "Fred"
                    .ChartType = SeriesChartType.Column
                    .XValueType = ChartValueType.String
                    .XValueMember = "Linename"
                    .YValueType = ChartValueType.DateTime
                    .YValueMembers = "ChartTime"
                End With

            End With

        Catch ex As OracleException

            MsgBox("Error: " & ex.ToString())

        End Try

    End Sub

    '''''The Helper Function '''''

    Private Function DTRow(ByVal Table As DataTable, ByVal fields() As Object) As DataRow
        Dim r As DataRow = Table.NewRow
        For i As Int32 = 0 To fields.GetUpperBound(0)
            r(i) = fields(i)
        Next

        'Note:  Adding row to Table does not work with this function called by LINQ

        Return r
    End Function


End Class

Once again, thanks for your help.. U can't imagine how happy I am today :)

I glad that you have it working. :))

First, regarding the timespan. From the result that i get, total sum that is more than 24 hours will be converted to 1 day, for example: 1.03:04:49.
How can I change the day to 24 hours like 1.03:04:49 will become 27:04:49. Is it possible to do like that?

Yes. There are two ways that I know of to do this. Here is the simplest one.

   Private Sub Chart1_FormatNumber(ByVal sender As Object, ByVal e As System.Windows.Forms.DataVisualization.Charting.FormatNumberEventArgs) Handles Chart1.FormatNumber

      If sender Is Chart1.ChartAreas("Fred").AxisY OrElse TypeOf sender Is System.Windows.Forms.DataVisualization.Charting.DataPoint _
         AndAlso e.ValueType = ChartValueType.DateTime Then
         ' recreate original TimeSpan
         ' Remember that the Chart control uses OADates
         Dim ts As TimeSpan = DateTime.FromOADate(e.Value).Subtract(myToday)
         e.LocalizedValue = Trim(String.Format("{0,4:##00}:{1,2:00}:{2,2:00}", _
                                          (ts.Days * 24) + ts.Hours, _
                                          ts.Minutes, _
                                          ts.Seconds) _
                                 )

      End If

   End Sub

Second, how can i set the Y-Axis to become larger so that the total hour can see clearly

First off, you could make the size of the control taller. There are several values you can set regarding the interval to display less info if that is what you mean. Here is an extend section of what I showed earlier. Its best to play with these and see if you like the results. Normally, I would recommend looking at the documentation, but is this case that is an almost useless activity.

   ' Setup the chart

   With Chart1
      '.Dock = DockStyle.Fill
      .DataSource = dt
      .Legends.Clear()
      .ChartAreas.Clear()
      .ChartAreas.Add(New ChartArea("Fred"))
      With .ChartAreas("Fred")

         .AxisY.Minimum = myToday.ToOADate
         .AxisY.Maximum = Math.Ceiling(CDate(dt.Compute("Max([ChartTime])", "True")).ToOADate)

         ' If this is too much for the maximum, try some variant of this
         ' by changing the AddHours value
         ''.AxisY.Maximum = DateTime.FromOADate( _
         ''                     Math.Floor(CDate(dt.Compute("Max([ChartTime])", "True")).ToOADate)) _
         ''                     .AddHours(6) _
         ''                     .ToOADate

      'Play with this to get the effect you want
      ' Use a value of zero (0) for the interval to allow the control
      ' to set the interval
         .AxisY.LabelStyle.IntervalType = DateTimeIntervalType.Hours
         .AxisY.LabelStyle.Interval = 4 'hours
         .AxisY.MajorGrid.Enabled = True
         .AxisY.MajorGrid.IntervalType = .AxisY.LabelStyle.IntervalType
         .AxisY.MajorGrid.Interval = .AxisY.LabelStyle.Interval
         .AxisY.MinorGrid.Enabled = True
         .AxisY.MinorGrid.IntervalType = DateTimeIntervalType.Hours
         .AxisY.MinorGrid.Interval = .AxisY.LabelStyle.Interval / 2

         .AxisX.LabelStyle.Format = "G"
         .AxisX.LabelStyle.Interval = 0
         .AxisX.LabelStyle.IntervalType = DateTimeIntervalType.Auto
      End With
      .Series.Clear()
      .Series.Add(New Series("Wilma"))

      With .Series("Wilma")
         .ChartArea = "Fred"
         .ChartType = SeriesChartType.Column
         .XValueType = ChartValueType.String
         .XValueMember = "Label"

         .YValueType = ChartValueType.DateTime
         .YValueMembers = "ChartTime"

         ' This adds the Value to the column
         .SmartLabelStyle.Enabled = False
         .Label = "#VAL"
         .LabelAngle = -90

         .LabelForeColor = Color.White
         .LabelBackColor = Color.DarkBlue
         .Font = New Font(.Font.FontFamily, 10, FontStyle.Regular, GraphicsUnit.Point)
      End With

   End With

Dear TnTinMn..

I got a request to change the chart. Now, I have to divide the total sum that we get from the LINQ with the count of how many duration event for each line (for example total sum for line A1 is 03:33:33, i have to divide it with 3 times the duration event occured. So the result is 01:11:11)

Can we do this straight from LINQ?

or i have to create a function with another dataset to store the count value for each line, then another function to store the sum value for each line and another function to divide the sum and the count value that we get from the function?

So what you want is the the arithetic mean (average) of the timespan values? This can be done using the "Average" function instead of the "Sum" function. However the "Average" function will return a value of type "Double" and the TimeSpan constructor takes a "Int64" type, so a type conversion is needed as well.

Change:

  Select DTRow(grpDT, _
               New Object() {LINENAME, _
                             myToday.Add( _
                                         New TimeSpan( _
                                                      grp.Sum(Function(r2 As DataRow) TimeSpan.Parse(r2.Field(Of String)("EVENTTM")).Ticks) _
                                                     ) _
                                        ) _
                            } _
              )

to:

  Select DTRow(grpDT, _
               New Object() {LINENAME, _
                             myToday.Add( _
                                         New TimeSpan(CType( _
                                                              grp.Average(Function(r2 As DataRow) TimeSpan.Parse(r2.Field(Of String)("EVENTTM")).Ticks),  _
                                                              Int64 _
                                                            ) _
                                                     ) _
                                        ) _
                            } _
              )

Tanx for your reply. However, I got an error like below. How can I fix this?

Tanx for your reply. However, I got an error like below. How can I fix this?

I had merged the Date.Add into the LINQ. This should work.

  Select DTRow(grpDT, _
               New Object() {LINENAME, _
                                         New TimeSpan(CType( _
                                                              grp.Average(Function(r2 As DataRow) TimeSpan.Parse(r2.Field(Of String)("EVENTTM")).Ticks),  _
                                                              Int64 _
                                                            ) _
                                                     ) _
                            } _
              )

It works just like what I want!

anyway, do you have any recommended site or good online tutorial about LINQ that I can learn and be an expert just like u? hehe..

Thank you from the bottom of my heart for your support. I realy appreciate it.. Thanks a lot TnTinMN :)

TnTinMN,
i have another question. I also want to show the count for each line. Can I edit it from the LINQ. For example like this:

'Now the LINQ
'This LINQ use a helper function (DTRow) to create the DataRow
    Dim group As IEnumerable(Of DataRow) = _
        From row In Ds.Tables(0).AsEnumerable() _
        Group row By LINENAME = row.Field(Of String)("LINENAME") Into grp = Group _
        Order By LINENAME _
     Select DTRow(grpDT, _
       New Object() {LINENAME, grp.Count(Function(r2 As DataRow) (r2.Field(Of String)("LINENAME"))), _
         New TimeSpan(CType( _
          grp.Average(Function(r2 As DataRow) TimeSpan.Parse(r2.Field(Of String)("EVENTTM")).Ticks),  _
            Int64 _
              ) _
        ) _
      } _
    )

Is this correct? But why is has error like below:

I'm freehanding these modifications to add the count field, but I sure that you will let me know if it throws an error. ;)

  Select DTRow(grpDT, _
           New Object() {LINENAME, _
                         New TimeSpan(CType( _
                                            grp.Average(Function(r2 As DataRow) TimeSpan.Parse(r2.Field(Of String)("EVENTTM")).Ticks),  _
                                             Int64 _
                                             ) _
                                       ), _
                          grp.Count() _
                        } _
          )

Now you need to make room for the count in the datatable.

        Dim grpDT As DataTable = Ds.Tables(0).Clone 'Copy structure of original Table
        'Make the changes you indicated to the Table structure.  You can do this as long as the table is empty.
        grpDT.Columns("EVENTTM").DataType = GetType(TimeSpan)
        grpDT.Columns("EVENTTM").ColumnName = "DURATION"

' ********  Column to hold Count        
        grpDT.Columns.Add("Count", gettype(Int32))

As far as examples of LINQ go, there are a lot of them out there.

Just search:

  • MSDN LINQ VB 101 Examples
  • MSDN IEnumerable LINQ extensions
  • MSDN IEnumerable

Unfortunately, MS created an abomination called the anonymous type in some perverted effort to make writing LINQ queries simpler. If you read some of their BS, they will claim that you have to use the Anonymous type to hold the result. This is total misinformation and they can not even keep their own ranks in line as many of them write LINQ examples, as I have shown you, using a strongly typed target variable. This is a somewhat of a style preference, but to use the anonymous type you have to have Option Infer On, and this goes against my personal philosphy. I believe code should explicitly state the coder's intent and not leave things up to the compiler to guess what I want.

My 3 Rules

  • Option Strict On
  • Option Explicit On
  • Option Infer Off

Crazy old man is now getting down off of his soap box.

Don't be afraid to try things. You won't hurt the compiler's feelings as it does not have any.

Thank you TnTinMN.. As expected, the count function works great :)

But the chart that i'm trying to generate is not appear like what i want.
I want the chart to have 2 series.

X-axis to hold the linename
Y-axis to hold the average duration
another Y-axis to hold the count

currrently i this is the code i'm trying to generate the chart:

   ' Setup the chart
            With Chart1
                .DataSource = grpDT
                .Legends.Clear()
                .ChartAreas.Clear()
                .ChartAreas.Add(New ChartArea("Fred"))
                With .ChartAreas("Fred")
                        '  .AxisY.Minimum = myToday.ToOADate
                        '  .AxisY.Maximum = Math.Ceiling(CDate(grpDT.Compute("Max([ChartTime])", "True")).ToOADate)
                    .AxisY.LabelStyle.Format = "HH:mm:ss"
                        ' If this is too much for the maximum, try some variant of this        
                        ' by changing the AddHours value         

                    .AxisY.Maximum = DateTime.FromOADate( _
                    Math.Floor(CDate(grpDT.Compute("Max([ChartTime])", "True")).ToOADate)) _
                   .AddHours(0.1) _
                   .ToOADate

                        'Play with this to get the effect you want
                    .AxisX.LabelStyle.Interval = 1
                    .AxisY.LabelStyle.IntervalType = DateTimeIntervalType.Hours
                    .AxisY.LabelStyle.Interval = 0.01 'hours         
                    .AxisX.LabelStyle.Format = "G"
                        '  .AxisX.LabelStyle.Interval = 0
                    .AxisX.LabelStyle.IntervalType = DateTimeIntervalType.Auto
                    End With

                .Series.Clear()
                .Series.Add(New Series("Wilma"))

                With .Series("Wilma")
                    .ChartArea = "Fred"
                    .ChartType = SeriesChartType.Column
                    .XValueType = ChartValueType.String
                    .XValueMember = "Linename"
                    .YValueType = ChartValueType.DateTime
                    .YValueMembers = "ChartTime"
                    End With

                    ' .Series.Clear()
                .Series.Add(New Series("Series2"))


                With .Series("Series2")
                    .ChartArea = "Fred"
                    .ChartType = SeriesChartType.Point
                    .XValueType = ChartValueType.String
                    .XValueMember = "Linename"
                    .YValueType = ChartValueType.DateTime
                    .YValueMembers = "Count"
                    End With


                End With

But the result is like this:

chartErr

What can i alter to make the chart to become like this:

chart1

Set the Series2.YAxisType to Secondary

            With .Series("Series2")
                .ChartArea = "Fred"
                .ChartType = SeriesChartType.Point
                .XValueType = ChartValueType.String
                .XValueMember = "Linename"
                .YValueType = ChartValueType.DateTime
                .YValueMembers = "Count"
                .YAxisType = System.Windows.Forms.DataVisualization.Charting.AxisType.Secondary
                End With

Yes it works!!

I dont know how to express my appreciation towards you TnTinMN.. Thank you for your help and support.. I've learned many things from you. Thanks again TnTinMN :)

Be a part of the DaniWeb community

We're a friendly, industry-focused community of developers, IT pros, digital marketers, and technology enthusiasts meeting, networking, learning, and sharing knowledge.