Hi,
How can i draw a horizontal line in my chart?
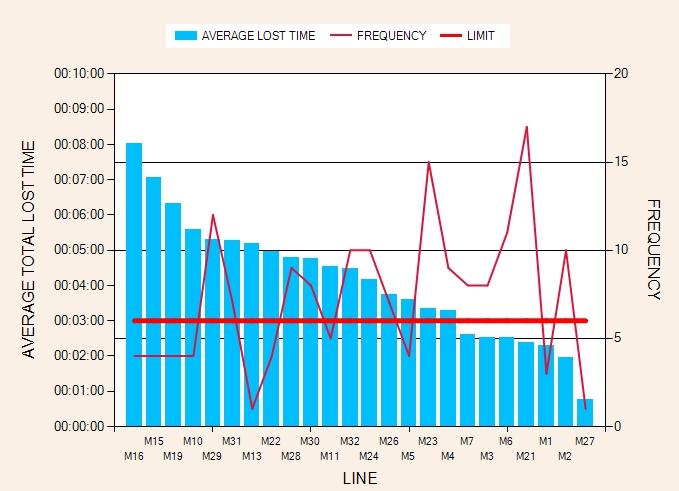
Currently my chart look like below:
Before this i use below code to draw it but when i try to draw with this application (Y axis in datetime), it give me error like 'make sure not dividing by zero'
    Private Sub Chart1_PostPaint(ByVal sender As Object, ByVal e As ChartPaintEventArgs) Handles Chart1.PostPaint

        If TypeOf e.ChartElement Is ChartArea Then

            Dim area As ChartArea = CType(e.ChartElement, ChartArea)

            Dim x1 As Single = CSng(area.AxisX.ValueToPixelPosition(area.AxisX.Minimum))
            Dim x2 As Single = CSng(area.AxisX.ValueToPixelPosition(area.AxisX.Maximum))
            Dim y As Single = CSng(area.AxisY.ValueToPixelPosition(20))

            e.ChartGraphics.Graphics.DrawLine(New Pen(Color.Blue, width:=5), x1, y, x2, y)

        End If

    End Sub
Actually, I dont know what to put in the axisY.valuetopixelposition() because when i try to put something like 00:03:00 it give me syntax error.
I also tried to create another series with "00:03:00" value in the y axis and got the below result:
But as we can see, the line only start at 1st point of X-axis value, not from the Y-axis line.
Can someone help me please..

