OMG Optimization.... One of those things that is widely discussed but with no real specifics because everyones setup and situation is different.

So I spent all day trying to find ways to accomplish this as our SQL server was maxed out. Let me do a bit of setup explination....

We have a semi-popular website that uses ajax extensively. These element refreshes are done partially with the aid of a CRON that runs every 60 seconds. The CRON runs some PHP files, a couple of which loop while() 59 times. Some of those loops query the database for results.

The website uses two servers (local to eachother) one for Apache, and one for MySQL.

Apache Server:
Ubuntu Server 10.04.4
Linux 2.6.32-41-server on x86_64
Apache version 2.2.14
AMD Phenom(tm) II X6 1045T Processor, 6 cores
8GB DDR3

MySQL Server:
Ubuntu Server 12.04
MySQL version 5.5.24
Linux 3.2.0-26-generic on x86_64
Intel(R) Core(TM) i7-2600K CPU @ 3.40GHz, 8 cores
8GB DDR3

So today the site was extremely slow (locally), I checked the 2 servers. The apache server was at a little over 1% cpu utlization and the MySQL server was at 99%. This is a fairly new website so we are discovering things as popularity grows. I know enough to install MySQL successfully and deal with tables as they relate to php, but I am no guru when it comes to proper configuration to get the best out of it. So I did what anyone would do.... I scowered the web for optimization tips that best relate to our situation. I made some changes to the my.cfn file.

Changed:
Key buffer size to 1024M
Query cache size to 2048M

Nothing else I found was relevant... but as I said, I am no guru with mysql.

Here is what mysqltuner.pl had to say about the changes....
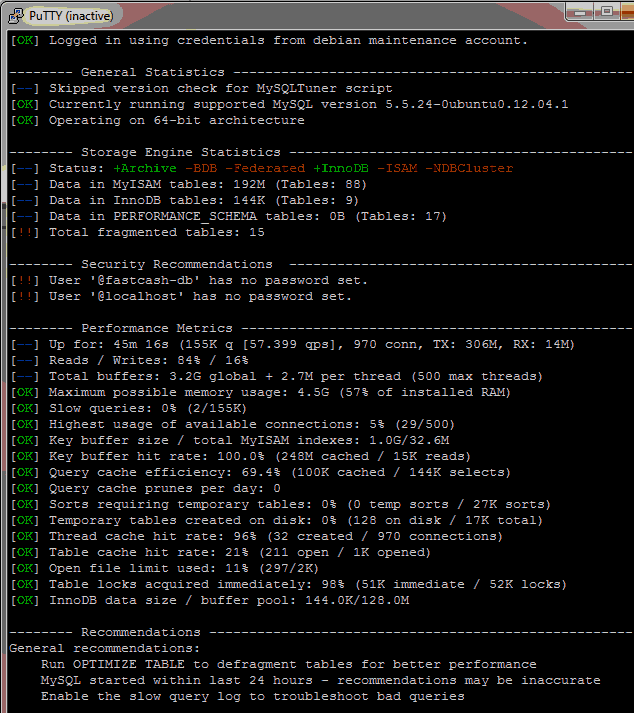
mysqltuner

OK... so not bad right? Everything looks good...

NOPE!

Here is what TOP had to say about it....
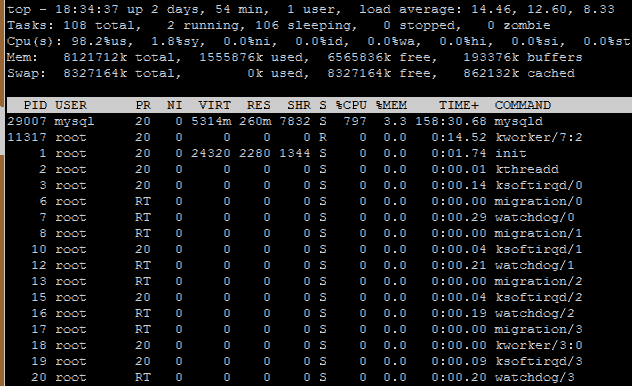
top

Not good, and no change.

Actually the only thing that helped is when I killed all the DB connections, but of course that killed ajax until the next minnute came up and the CRON kicked in. And with that the issue came back.

I don't know what to do short of setting up another DB server and cluster them for load balancing and even that is not my forte.

Any help would be very appreciated in this matter from someone that knows more than I do about this.

Thank you in advance.

Recommended Answers

All 6 Replies

Check for slow queries. (Look up how to enable the slow query log in my.cnf). Check if you can optimize the slowest. Also have a look at the process list while mysql is running under high load. (show processlist from the mysql command line). Which processes are open? Just waiting for connections, or what are they doing?

Thank you for the reply.

I turned on the error-log which I feel was a good thing because...

I turned on the slow query log, but ran into a problem.

/usr/sbin/mysqld: File '/var/log/mysql-slow.log' not found (Errcode: 13)
120715 14:11:19 [ERROR] Could not use /var/log/mysql-slow.log for logging (error 13). Turning logging off for the whole duration of the MySQL server process. To turn it on again: fix the cause, shutdown the MySQL server and restart it.

Permissions and ownership of mysql-slow.log is set the exactly the same as mysql.err, in the same directory and there is no issues writting to the .err log.

Woke up today without being able to access the website. All services we running. TOP was reporting 110.03 load. There were probably 50 database connections (which is more than normal). As soon as I killed them everything was fine.

Any ideas?

Why are connections kept open so long? Did you try to reduce the connection idle time (the timespan a connection waits for new input until it closes - I forget the names of the relevant parameters) ?

I'm not sure, and actually I think that was a fluke as it has not happened again.

I will say this, it is amazing the difference index's make. I thought through the php making the calls, and started with the calls that happened most often.... setup indexes for the columns that are called and wow!

The CPU load went from 99-100% to about 1%, yeah 1 percent. Now thats more like it. Without the index the i7 was sifting through 2.5 million rows every second, with the index it knows what to look for and acts as an i7 should. Crazy.

I still can not get the slow query log thing to work ... See 3 posts up.... Anyhelp on that would be great, and if a beautiful SQL vixen would like to come teach us (me mainly) some lessons that would be fantastic. =)

Oh well. Indexes. Who would have guessed that you did not use them in the first place...
Regarding the logging problem: show the relevant lines from my.cnf and a long listing of the /var/log directory.
And activate the option

log-queries-not-using-indexes

in my.cnf, in case you forget to use indexes another time.
And learn to use the EXPLAIN statement.

Be a part of the DaniWeb community

We're a friendly, industry-focused community of developers, IT pros, digital marketers, and technology enthusiasts meeting, networking, learning, and sharing knowledge.