Hello ,
i am making a website and have difficulties using Google Chart API.
I am using a annotated timeline chart and it works.
But i want to change the look of the chart and i am having difficulties with that .
Mayby somebody here can help me ?
Here is what i have :
<script type="text/javascript" src="https://www.google.com/jsapi"></script>
    <script type="text/javascript">
      google.load("visualization", "1", {packages:["annotatedtimeline"]});
      google.setOnLoadCallback(drawChart);
      function drawChart() {
        var data = new google.visualization.DataTable();
        data.addColumn('date', 'Datum');
        data.addColumn('number', 'Waterverbruik');
        data.addColumn('string', 'title1');
        data.addColumn('string', 'text1');

        var aantal = document.getElementById("aantalMeterstanden").value;
        var a = parseInt(aantal);
        i=1;
        while (i < a)
              {
              var jaar = document.getElementById("txtJaar"+i).value;
              var maand = document.getElementById("txtMaand"+i).value;
              maand=maand-1;
              var meterstand = parseFloat(document.getElementById("txtWater" +i).value, 10);
              var ddatum = new Date(jaar, maand, 1);
                data.addRows([[ddatum, meterstand, null, null]]);
              i++;
              }

        var annotatedtimeline  = new google.visualization.AnnotatedTimeLine(document.getElementById('visualization'));
        annotatedtimeline.draw(data,
            {allValuesSuffix: " m³"},
            {dateFormat: 'yyyy , MMMM'},
            {displayAnnotations: true},
            {displayDateBarSeparator: false},
            {displayZoomButtons:true}
                    );

      }
    </script>
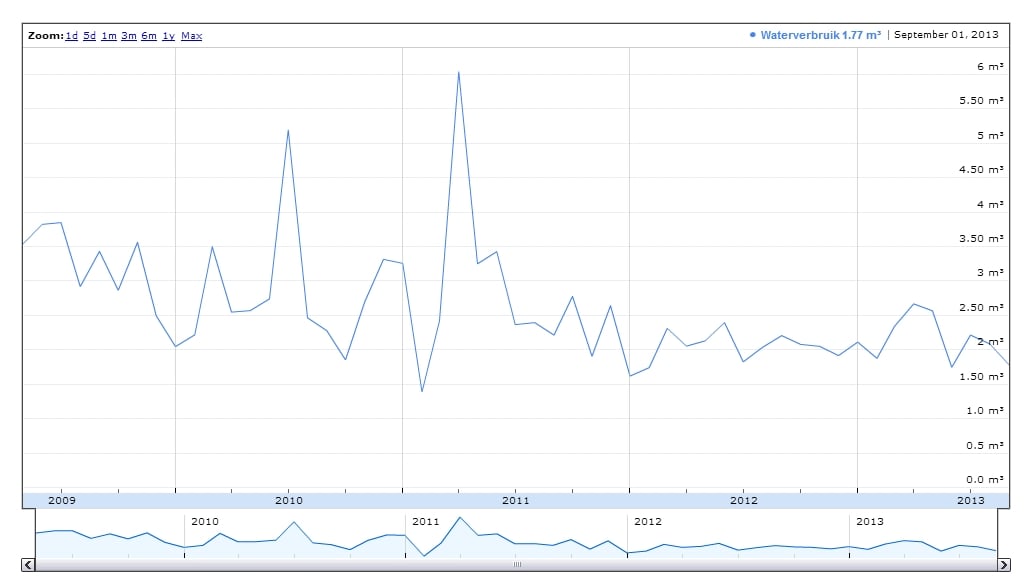
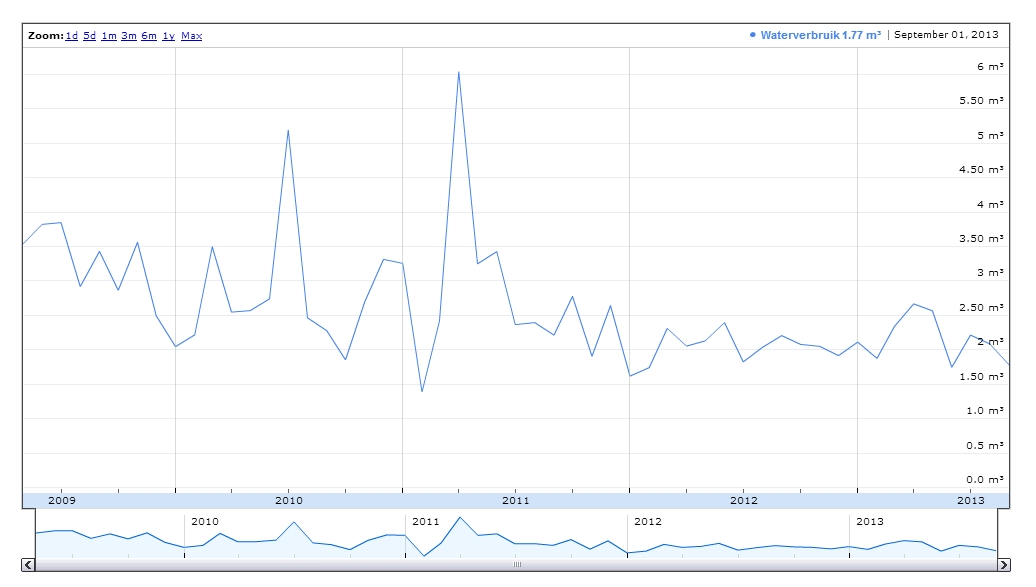
All works well , the problem is with the last part of the code : annotatedtimeline.draw
Problem 1 :
dateFormat : does not work , i want the date to show 2013 september instead of September 01 , 2013
Problem 2 :
displayDateBarSeparator : does not work , i dont want the text separator
Problem 3 :
displayZoomButtons : this works , but i want to change the zoom buttons from 1d,5d,1m,3m,6m,1y,max
to zoom buttons 3m,6m,1y,2y,5y,10y,max
Problem 4 :
the scale for my Y-values is on the right side. Is there a way to have them both on the right as on the left side ?
Hope somebody out here can help me with these problems ?
Thanks.