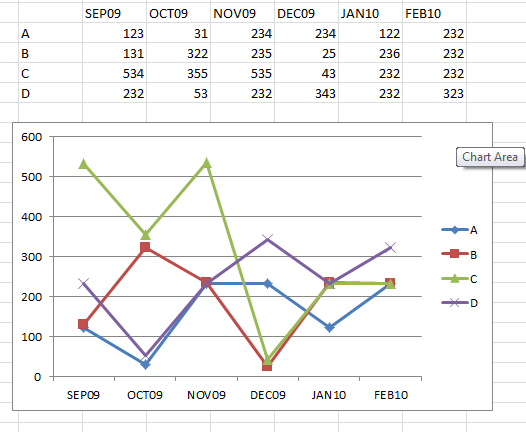
Hi, i am trying to get create a line chart with using WPF, the chart will show a trend of a data on a time range, so the chart will show the value of several series of data on months interval, this is what im trying to achieve:


i made that one on excel.. but it is basically what im trying to do, i found several documentation on WPFtoolkit on MSDN, but it seems different from what im using, the methods, the attributes, and some others.

another problem is the time range, i dont know what is the time range of the data, so, how do you suppose i should define the data?

any help or directions is greatly appreciated. thank you.

Recommended Answers

All 3 Replies

Hi, guilt99! Welcome here! :)
It is of little use to try to produce the most beautifull graph in the world, if you are not sure about the data!
Unless you work in the advertising bussiness or something, where a flashy graph is often more important than the data.

i am not trying to create anything flashy, any kind of graph will do as long as it shows the data, the problem i am facing now is that i dont know how to bind the data as the title of the coloumn (the months) is supposed to be dynamic...

If you're using a control, than it must have some properties to set the X and Y data.
Update these at runtime to be dynamic.
If you do all the drawing yourself, than there should be even less problems.

Be a part of the DaniWeb community

We're a friendly, industry-focused community of developers, IT pros, digital marketers, and technology enthusiasts meeting, networking, learning, and sharing knowledge.