Back around 2004 and 2005, I had embarked on a web project that included the ability for my users to draw on a web page—or at least, that was one of the requirements. At the time, most of my web development had been server-side, with very little JavaScript. Long story short, I ended up shelving the project—not because the project wasn’t a good idea (it was a project planning and collaboration tool), but because the browsers simply weren’t up to it. I explored numerous libraries for drawing on the browsers, but talk about a major headache. The reason for the trouble was simple: Some browsers didn’t include any drawing support and instead required a plugin, and other browsers had built-in support but there was no common standard. Firefox used SVG, but to use SVG in IE, you needed a plugin. But the only decent plugin was created by Macromedia, but they got bought by Adobe, and they shut down the project. Instead, with IE, you had to use Microsoft’s own technology, VML.
To this day, it astounds me that Microsoft refused to include support for SVG in their earlier browsers and instead tried to embrace their own proprietary technology (which is actually nothing unusual for them.) And I suppose Adobe might have seen SVG as a threat to Flash, which they also acquired when they bought Macromedia, and perhaps that’s why they shelved the SVG plugin. But SVG was—and still is—an excellent technology dating back to 2001. Either way, SVG support in IE was limited, and if I created a web site that used it, my users would have to install a plugin that might not be available in the future. And it was either that or write two separate versions of my code, one for IE, and one for, well, almost everything else.
While there were other options available, such as using Flash or Silverlight, these didn’t set well with me because I needed to give my users the ability to draw anywhere on a page. I did find a really odd library that would plot lines using tiny, single-pixel-sized divs that were colored. But a single line could use hundreds of divs, and a full-color 500 by 500 pixel drawing could end up using as many as a quarter million div elements! No thank you. I like my app to use less than eight Gig of RAM, thank you very much.
Now, fast forward six or seven years, and we have modern browsers that all support drawing natively without extra plugins. Virtually all of them support SVG and, to some extent, the new HTML5 Canvas tag. (And I welcome that, considering a few years ago it looked like companies were turning their back on such a good technology as SVG.) Finally, drawing is easy in these browsers. But while the new browsers all support drawing, there are still some differences. But the drawing is there, and it can be accessed by JavaScript. And that’s where ExtJS 4 comes in.
In April of this year, Sencha released the 4th version of ExtJS. It has quite a few improvements, but the set I want to focus on in this article is the drawing tools. (If there’s interest from DaniWeb readers, I’ll review other portions of ExtJS in future articles.) Sencha has worked hard to create a powerful, cross-browser drawing library that detects the browser and uses the best drawing tools available to the browser. You, the programmer, just use the Sencha drawing library, and it does the rest.
Although this is the 4th version of ExtJS, it’s really the first version of the drawing tools, so there are still some improvements that need to be made, but it’s a great start. Let’s take a look at it.
Trying it Out
If you’re new to ExtJS or even JavaScript, you might be a little surprised to see how you call functions in ExtJS. Instead of simply passing numerous parameters into the ExtJS functions and constructors, you typically pass a single object with multiple members. Over the past few years, though, this has become more common in the JavaScript world, as it provides great flexibility in parameter passing, including the handy feature of not having to provide a particular ordering.
Before looking at the code, however, first take a look at these examples. Open these up http://www.sencha.com/products/extjs/examples/ in a separate browser tab (so that you can easily return back here to DaniWeb!). This page includes a whole set of examples showing the huge range of controls available in ExtJS. For our purposes here, take special note of the Charts examples and the Drawing examples. Check out the one in the Drawing section with a green squiggle in particular. It’s the Sencha logo and it looks like this:
In the actual example, however, you can resize it. Notice that it scales nicely. That’s because it’s a vector drawing.
I tested this example out in several browsers, including IE 9, IE8, and even IE6, and it works in all three. I tested it out in Firefox back to 2.0, and it works in all the Firefox versions I tested. (But in Firefox 2.0, it wasn’t resizable.) Using Chris Pederick’s Web Developer extension for Firefox, I was able to see that with all the versions of Firefox, ExtJS is using the built-in SVG support. I didn’t have the appropriate tools with IE to determine what it was using; however, the documentation at Sencha’s site says the library leverages SVG and VML. I’m guessing, therefore, that IE9 is using SVG (since it’s available) and earlier IE is using VML. I should also point out that at present ExtJS does not use the HTML5 canvas tag yet; however, they say support for it is coming. (But in my opinion, that’s not a big deal as all the major browsers now support SVG, and I personally think SVG is an excellent technology.)The Code
The code is rather interesting, in that it’s all vector drawing. Here’s the first part that initializes the drawing object. (The function inside Ext.onReady gets called after the page has loaded; thus, you put your initialization code inside that function. If you’re familiar with jQuery, this is similar to document.ready().)
Ext.onReady(function() {
    var sencha = Ext.create('Ext.draw.Component', {
        width: 300,
        height: 300,
        resizable: { dynamic: true, pinned: true, handles: 'all' },
        renderTo: Ext.getBody(),
I cut off the code in the middle of the initialization object, but so far we have initialization members that set the height, width, and resizing information. Then we have a member that tells where to render the object when it draws, in this case, the body element of the document.
Next is the actual drawing information. Here’s more of it; this is declaring some gradient objects:
gradients: [{
    id: 'grad1',  angle: 100,
    stops: { 0: { color: '#AACE36' }, 100: { color: '#2FA042' } }
}, {
    id: 'grad2', angle: 21,
    stops: { 0: { color: '#79A933' }, 13: { color: '#70A333' },
        34: { color: '#559332' }, 58: { color: '#277B2F' },
        86: { color: '#005F27' }, 100: { color: '#005020' }
    }
}, {
    id: 'grad3', angle: 55,
    stops: { 0: { color: '#79AB35' }, 53: { color: '#7CBA3D' },
        100: { color: '#00AA4B' }
    }
}],
Now comes the actual drawing information. I’m not going to include the whole thing here (the sample page has a link with the entire source). But it’s a sequence of drawing primitives that looks like this:
items: [{
    type: 'path',
    path: ['M0,109.718c0-43.13,24.815-80.463,60.955-98.499L82.914,0C68.122,7.85,58.046,23.406,58.046,41.316',
    'c0,9.64,2.916,18.597,7.915,26.039c-7.44,18.621-11.77,37.728-13.228,56.742c-9.408,4.755-20.023,7.423-31.203,7.424',
    'c-1.074,0-2.151-0.025-3.235-0.075c-5.778-0.263-11.359-1.229-16.665-2.804L0,109.718z M157.473,285.498c0-0.015,0-0.031,0-0.047',
    'C157.473,285.467,157.473,285.482,157.473,285.498 M157.473,285.55c0-0.014,0-0.027,0-0.04',

    // ... more deleted here ...

    'C157.467,286.208,157.467,286.212,157.467,286.214'].join(''),
    fill: '#C5D83E'
}, {
    type: 'path',
    path: ['M66.218,210.846l-6.824-3.421c-0.016-0.009-0.033-0.018-0.048-0.025',
    'c-0.006-0.003-0.013-0.007-0.019-0.01c-0.01-0.005-0.017-0.009-0.028-0.015c-0.009-0.005-0.016-0.008-0.025-0.013',

    // ... more deleted here ...

    'c11.18-0.001,21.795-2.669,31.203-7.424C50.44,154.002,55.248,183.676,66.218,210.846'].join(''),
    fill: 'url(#grad1)'
}, {
At the end is a reference to one of the gradient objects. Generally speaking, you probably don’t want to code the path points yourself directly, if you value your sanity. Instead, you would probably do what Sencha did to generate this sample: They started with a drawing tool (I’m guessing they used InkScape), exported the SVG, and from there grabbed out the path data and manually fixed it up for JavaScript.
Now notice what makes this code special: Nowhere is there a reference to the technology used (SVG, VML, etc.). Instead, you just provide the high-level specification of what you want, and behind the scenes ExtJS determines what actual technology is available to the browser. That means you can write one set of code, and it’ll run on pretty much any browser. That’s exactly what I needed a few years back but didn’t have.Charting
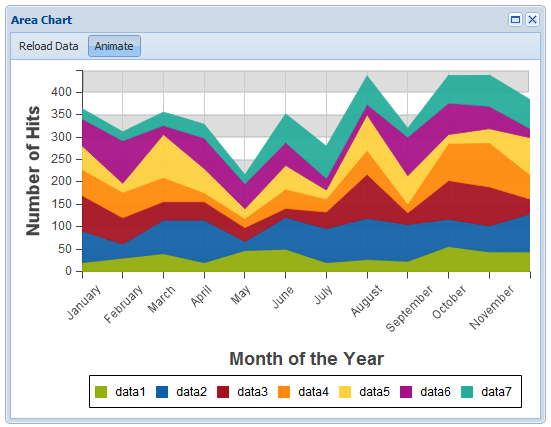
In addition to drawing primitives, ExtJS has some fantastic charting capabilities that make use of the drawing primitives. That means you can do charting without requiring your users to install any browser plugins, and without resorting to things like Flash. Check out the same samples page, this time in the Charts section; try out the first one called Area Charts, which looks like this:
Click the Reload Data button above the chart, and notice how the data is animated as it changes. For these examples, there’s a function that generates random data. In this case, the data is a two-dimensional array, and the data points are stacked.
If you look at the source, you’ll want to be a little familiar with ExtJS to understand what it’s doing. In a nutshell, it’s creating a popup window; that’s what the call starting with
var win = Ext.create('Ext.Window', {
does.
Inside the initialization object is a member called items. That contains the controls that will appear inside the window. This can be a list of objects, or just a single object if there’s only one control. This example contains only one control, and it’s the chart control. Here’s the first part of the object:
{
    id: 'chartCmp', xtype: 'chart', style: 'background:#fff',
    animate: true,
    store: store1,
    legend: { position: 'bottom' },
The first two members, id and xtype, give the control a unique ID and specify the type of control, respectively. (In ExtJS, you have two ways of creating controls: One is by calling new on a constructor function for the exact type you want. The other is to create a simple object and give it a member called xtype. xtype contains a string specifying the type of object you want. When I first started with ExtJS a few years ago, I used the first approach, calling new, until I realized it was actually easier to just set the xtype.)
The third member, style, is just a CSS style for the chart. The fourth member, animate, is the initial state of whether the chart animates upon data changes. (And as you can see from using the example, this can be changed at runtime.)
The next member here is store. That’s a member used in many of the controls in ExtJS; that’s where you provide the data. ExtJS includes many different types of store objects, and these objects push data into the controls. The different types of store objects used different means for getting the data, including Ajax or just hard coded as arrays. That makes for a handy way for accessing data from very different sources without having to worry about the details.
Next is an object describing the axes of the chart:
axes: [{
    type: 'Numeric', grid: true, position: 'left',
    fields: ['data1', 'data2', 'data3', 'data4', 'data5', 'data6', 'data7'],
    title: 'Number of Hits',
    grid: {
        odd: { opacity: 1, fill: '#ddd', stroke: '#bbb', 'stroke-width': 1 }
    },
    minimum: 0, adjustMinimumByMajorUnit: 0
    }, {
    type: 'Category', position: 'bottom',
    fields: ['name'], title: 'Month of the Year',
    grid: true,
    label: { rotate: { degrees: 315 } }
}],
I’m not going to go into details about these items; most are self-explanatory, and the whole thing is documented in the excellent ExtJS API documentation, which you can find here. http://docs.sencha.com/ext-js/4-0/
Next is an object called series:
series: [{
    type: 'area', highlight: false, axis: 'left', xField: 'name',
    yField: ['data1', 'data2', 'data3', 'data4', 'data5', 'data6', 'data7'],
    style: { opacity: 0.93 }
}]
This is actually where you specify the type of chart. The first member of this object is called type, and has the string "area". That means a stacked area chart. (The available types are area, bar, cartesian, column, gauge, line, pie, radar, scatter, series.) The additional members of this object are described in the API and are again mostly self-explanatory. (Tip: When you download ExtJS, you get with it all these examples, and you can easily play with them and change them. Try changing some of these options so you can get the feel for how they work.)
All in all, the charting is very straightforward and easy. Look at what we did here: We created a component of type chart, set a few properties like whether to animate it, provided a data store, then specified what the axes look like, and finally the type of chart along with specifics for that type of chart. That’s it. While the object stretches many lines of code, it’s actually all a single call and mostly just declaration. In other words, it’s incredibly easy to create a chart. And like the drawing, you don’t have to provide any details about the technology used. ExtJS takes care of all that for you. This is a very high-level approach and it works well.Licensing
Whenever I review ExtJS, two things happen in the comments that follow: First, some people who have a competing product show up to trash ExtJS, saying every possible bad thing they can about it. Second, people gripe about the licensing issues (and some even sending me private emails about it as if I’m somehow connected to the company, which I’m not—I’m an independent consultant who writes for DaniWeb as a freelancer).
The licensing issue people gripe about is this: ExtJS uses a dual-licensing model where you can either purchase a commercial license, or use an open source license. But there’s a catch, and that’s what makes some people mad. The open source license is GPL v3. I’m not a lawyer or an expert about licensing, but as I understand it, this means that you cannot use the open source license to create a closed-source commercial product. If you use the open source license, the product you create must be open source. If you want to create a closed-source commercial product, you have to purchase a commercial license. (But again, I’m not an expert and these sentences are just my own short interpretation. Don’t base your decisions on what I’m saying here; instead, see the Sencha web site for details.)
If you prefer to go the commercial route, a single-developer license with "Standard support" costs $595. A license for five developers (plus premium support) is $2695, and a 20-developer license with premium support is $9,995. (A year and a half ago I reviewed version 3.0 over at eWEEK.com, and the license for a single developer was $329. It’s gone up considerably. My personal feeling is that $329 was within reach for an individual programmer running a home-based software shop. $595, however, is getting a little expensive. I might be able to convince my wife to let me purchase a tool for $329, but I’m not sure she’d go for $595. But for a larger company, that’s probably doable.)
Either way, I don’t personally have a problem with the licensing model, as I know that the company exists to make a profit and pay its employees and needs a source of income. And if you’re embracing open source, most likely you’re also creating an open-source product. (And there might be an option in the license to create a commercial but open source product whereby you charge for your product but make the source available. Check with Sencha for details, though, as I could be mistaken.)
Conclusion
All in all, this is a fantastic product. I love the charting and drawing tools, and with this product now available, I may well be able to finally get back to the collaboration tool I had started developing several years ago.