hi all,
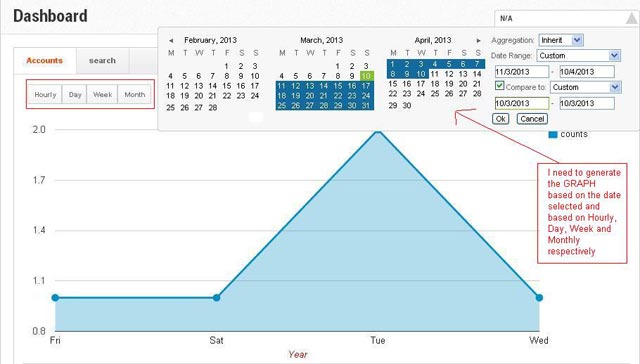
am trying to add google chart to my application. i want a graph like the one attached. Below is the code which i am using to generate the GRAPH. i am able to generate for only 1 graph
My question is how to pass value dynamically and to get repective graph.

 google.load("visualization", "1", {packages:["corechart"]});
          google.setOnLoadCallback(drawChart);
         function drawChart() {
                var jsonData = $.ajax({
                    url: "php/tracker.php",
                    dataType: "json",
                    async: false
                }).responseText;

                var obj = jQuery.parseJSON(jsonData);
                var data = google.visualization.arrayToDataTable(obj);

            var options = {
              chartArea:{left:50,top:30,width:"80%",height:"80%"},
              hAxis: {title: 'Year',  titleTextStyle: {color: 'red'}},
               series: {
                0: {
                    color: '#058dc7',
                    lineWidth: 3,
                    pointSize: 10
                }
            }
            };
            var chart = new google.visualization.AreaChart(document.getElementById('chart_div'));
            chart.draw(data, options);
          }