Greetings, first, I'm totally new to python.
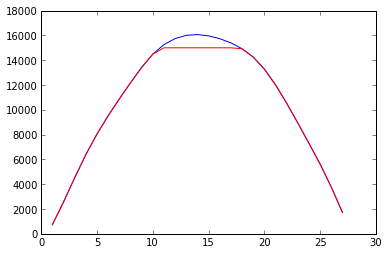
What I'm attempting to do is rebuild a clipped off sound wave.
As I've been poking around I've come across things like "cubic spline interpolation" (that sounds like what I need -- but really is way over my head)
I've come across other posts that I've gleaned some code from and have put together the following test program.
The data points are from a real (clean) wave cycle out of a sound file.
I'm then clipping a number of them to simulate a clipped wave.
The spline and interp1d routines do run, but output what I'm putting in.
So, looking for some experience/help/direction ... thanks
What I'd like to see are values similar to the original values I clipped.

#! python3.2
import sys
import os
import numpy as np
from struct import *
from scipy.interpolate import InterpolatedUnivariateSpline as spline
from scipy.interpolate import interp1d

wave = '''
728
2563
4520
6387
8044
9518
10874
12175
13418
14489
15259
15744
16005
16065
15963
15733
15400
14922
14251
13281
12007
10525
8927
7281
5609
3756
1712'''.strip().splitlines()
y_wavearray = np.array(wave,np.float64)
y_wavearray[14] = y_wavearray[13]           # clip top points
y_wavearray[15] = y_wavearray[14]
y_wavearray[16] = y_wavearray[15]
y_wavearray[17] = y_wavearray[16]
x_points = len(wave) +1
x_values = np.arange(1,x_points)
x_array = np.array(x_values,np.float64)
#cubic = spline(x_array, y_wavearray)
#for i in range(1,x_points):
#    print(i, wave[i-1], int(cubic(i) +.5))
cubic = interp1d(x_values, y_wavearray, kind='cubic')
for i in range(1,x_points):
    print(i, wave[i-1], int(cubic(i) +.5))

Recommended Answers

All 5 Replies

I think it works well. I changed the code to clip with np.clip() and plot the wave with matplotlib in ipython notebook (This was done with python 2). See the plot below

y_wavearray = np.array(wave,np.float64)
y_clipped = np.clip(y_wavearray, -np.inf, 15000)
x_points = len(wave) +1
x_values = np.arange(1,x_points)
x_array = np.array(x_values,np.float64)
cubic = interp1d(x_values, y_clipped, kind='cubic')
for i in range(1,x_points):
    print(i, wave[i-1], int(cubic(i) +.5))
import matplotlib.pyplot as plt
plt.plot(x_array, y_wavearray, '-')
plt.plot(x_array, cubic(x_array), '-r')

Thanks Gribouillis, that's encouraging.
The plot indeed looks like what I'm after. (I can't get matplotlib working yet, due to (more) needed requirements)
The odd thing is, when I look at the print of the points plotted, I see the clipped values, yet the plot looks right. Am I doing something wrong in my display routine ? It's the values that I'll eventually need.

for i in range(1,x_points):
    print(i, wave[i-1], int(cubic(i) +.5))

Here is what I see: (around the clip point)

...
9 13418 13418
10 14489 14489
11 15259 15000
12 15744 15000
13 16005 15000
14 16065 15000
15 15963 15000
16 15733 15000
17 15400 15000
18 14922 14922
19 14251 14251
...

I think you may misunderstand what cubic spline interpolation does. Here is a simple example

def attempt():
    # create sample points
    yval = np.array("""0.5917094   0.79290593  0.6781099
            0.97628959  1.11981829  1.01055748 0.95120918
            """.strip().split(), np.float64)
    xval = np.arange(1, 1 + len(yval))

    # plot sample points as blue dots
    plt.plot(xval, yval, 'ob')

    # compute cubic interpolation
    cubic = interp1d(xval, yval, kind='cubic')

    # plot the interpolation with a refined x-grid
    a, b = xval[0], xval[-1]
    xrefined = np.linspace(a, b, 100)
    plt.plot(xrefined, cubic(xrefined), '-g')


script = __name__  == "__main__"
if script:
    attempt()

Interpolation defines a smooth function joining the data points. All the values on these points are preserved. For example if 5 consecutive points have value 15000, the interpolated function will be close to a constant in this interval.

Thanks for the explanation and sample. I am still puzzled, however, in how does the plot software make the nice rounded curve if it's following the "flat" constant values ? is it doing something on it's own ?
Your example promted some thoughts that I have to play with too, thanks.

how does the plot software make the nice rounded curve if it's following the "flat" constant values ?

Think of 3 points in a plane. If they dont line up,there is exacly one circle passing through the 3 points. The circle is a example of a rounded curve following flat values. Interpolation does something similar with

  • A different kind of curve (piecewise polynomial instead of circle)
  • Different conditions (passing through all the points and having continuous derivatives, instead of only passing through 3 points)

The conditions are chosen so that exactly one curve of the chosen type satisfies these conditions.

Be a part of the DaniWeb community

We're a friendly, industry-focused community of developers, IT pros, digital marketers, and technology enthusiasts meeting, networking, learning, and sharing knowledge.