IE9 is on the horizon, and there has been plenty said about it. But what about its web development aspects? In this article I look at its web developer tools, and decide whether I'll start using it in my own web development.
Like most web developers, I abandoned IE several years ago, only using it when I have to fight with cross-browser compatibility issues (which, thankfully, have mostly gone away thanks to third-party libraries such as jQuery, where other people took care of the cross-browser headaches for me). At some point with an earlier version of IE, Microsoft managed to catch my attention very briefly when they announced their "Developer Toolbar." But after a bit of toying with it, I discovered it was just that--a toy.
Instead, like most web developers, much of my in-browser development time is spent using Firebug, the fantastic add-in for Firefox. (Firebug was, in fact, created by Joe Hewitt, who was involved in early Firefox development.) After Firebug had been around for a couple of years, the Chrome browser was released, and it has a built-in "Developer Tools" window, which is very similar to Firebug. Both work great, and in the past few months I've been spending more time in Chrome's debugger, trying to decide which I like better: Firebug of Chrome.
And now along comes Internet Explorer version 9. The official release isn't out yet, but it's coming soon, as the release candidate is out. The good news is that IE finally has a Firebug-like tool built into it. In fact, it's pretty clear from using it that it was heavily inspired by Firebug. And it even has a few features beyond Firebug. So the big question I want to tackle here is this: Is it good enough to suck me away from Firebug and Chrome's debugger? Or does it just suck? Now I'm going to be frank here; setting out to explore it, I'm skeptical--not for any reason other than that IE's debugging tools have not impressed me in the past. So Microsoft will have to do an extraordinary job to pull me away from my beloved Firebug and my recent love interest, Chrome Developer Tools.
Access through F12
Microsoft has been really promoting the fact that you can access the new IE developer tools simply by pressing F12. This, in fact, has been the way you could always access Firebug in Firefox (if you have Firebug installed), so I welcome this; it's nice being able to press the same key that I already do out of habit. But guess what: You could access the Develoepr Toolbar via F12 in the previous version, IE8! It's actually not anything new. (And besides, is it really that big of a deal which key I have to press to access it?)
I do find it a bit odd, then, that Microsoft is going to such lengths to promote the F12 access to the point that they're calling the developer tools "F12 Developer Tools." I'm guessing it's to catch the attention of us Firebug users. And apparently it worked on at least one person: Me. Here I am, trying it out. So let's give it a whirl and see what we find.
Console
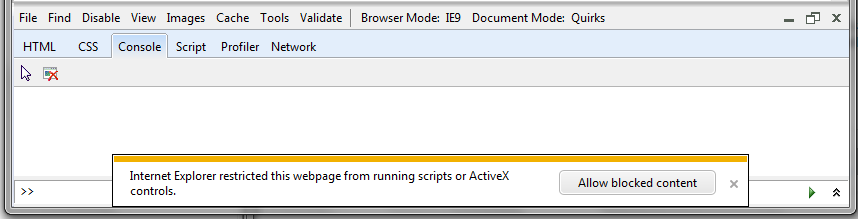
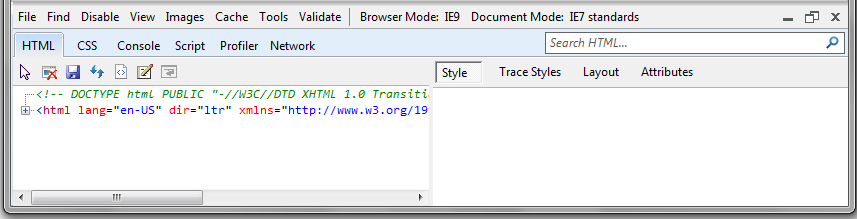
So what do you get when you press F12? Here's a screen shot; this is the bottom portion of the IE9 window:
Notice the console tab. Why is this a big deal? Because in the earlier IE8 developer toolbar, the console tab was there, but it seemed almost to be an afterthought, as you had to dig a little bit to get to it. Check out this screen shot from the older IE8's Developer Toolbar, and compare it to the screenshot above. The whole thing really isn't all that different, except for the Console missing:
Where is the console in the earlier IE8? It becomes available in when you click on the Script tab. So it was there, but now in IE9, it's more readily available. But in IE8, it was pretty useless. I won't give a breakdown or demo here since we're looking at IE9, but trust me, the console in IE9 is definitely better now. I'll look at it in more detail farther down in this article.
But first, I wanted to see just how errors would get reported in the IE9, as this has been a sore spot for a lot of developers in the past. We want to see our errors right in the console, with information about where the errors are. We don't want an annoying popup window for each error, as was the case with earlier versions of IE. So I created a simple HTML page that looks like this:
<html>
<body>
<script>
foobar();
</script>
</body>
</html>
I saved it to my hard drive, and opened it in IE9. And lo and behold, what did I see but this:
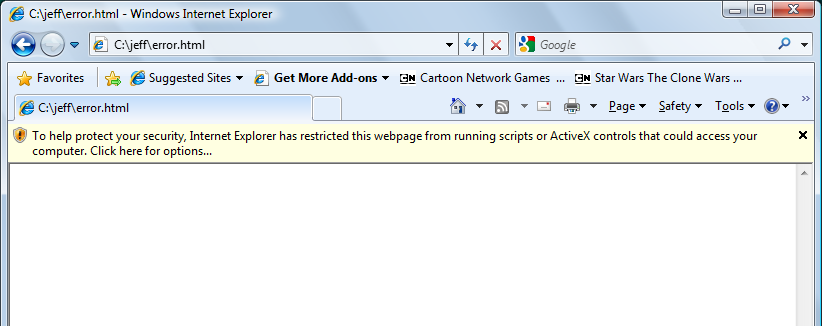
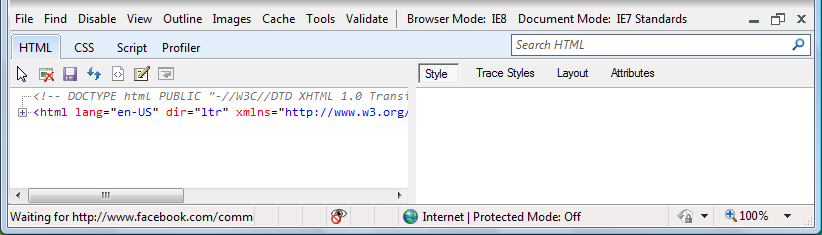
We're not off to a good start here. I don't want to have to "allow" my own local tests to run. This message is unrelated to the intentional error in my code; this happens any time you open a file on your local machine that contains JavaScript. And this was the case with earlier versions of IE, so some things obviously haven't changed. Here's the same thing in the older IE8:
I went ahead and clicked to allow blocked content. Fine. But fortunately, it didn't behave the same as IE8, which gave an additional popup warning. In IE9, that additional, annoying popup is gone.
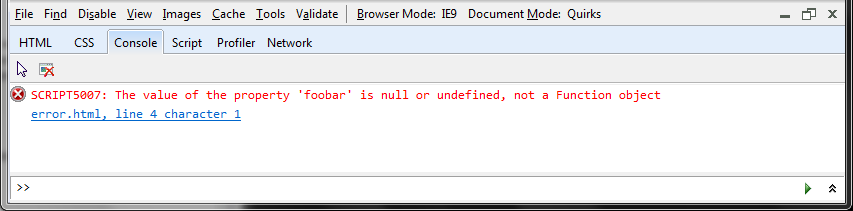
And now, finally, my JavaScript error was clearly displayed in the console, the way it should be.
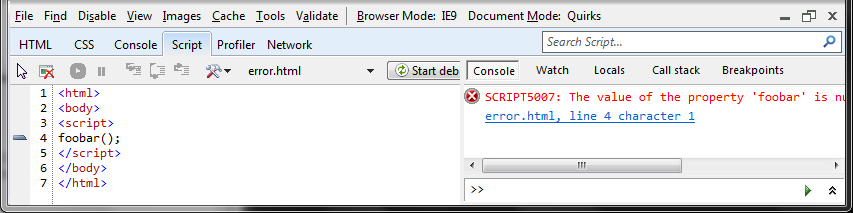
The error's line number has a hyperlink, so I clicked on it, and I can go right to the error in the source code. That's good:
(Incidentally, in this screen shot you can see the console has moved to the right-hand side now. That's where it appeared in the older IE8, and this aspect of the developer tool looks very similar to the IE8 tools. In fact, I'd guess it's reusing much of the same code.)
I then made a change to the file in my text editor, resaved it, and reloaded it in IE9. Aha, this time it didn't repeat the message about allowing blocked content. (Earlier versions of IE did.) Score one more.Playing with the Console
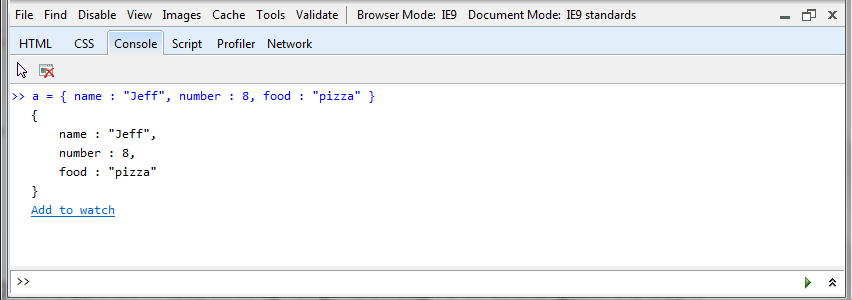
Since the console is the most important tool for me, and since the one in IE8 was useless, I thought I'd put this new console through the wringer. First, here's where I created a new JavaScript object in the console:
Check it out: IE9 displays it in valid JavaScript form, which means I could copy and paste it as-is into a JavaScript program:
{
	name : "Jeff",
	number : 8,
	food : "pizza"
}
Neither Firebug nor Chrome do that. In fact, Firebug has gone through a lot of changes in the way it displays objects, but in general it has stuck to the basic look of letting you expand and drill down into objects in a tree-view like interface. It's good, but you can't copy it as-is like you can with IE9. Dare I begrudgingly say "Score one for IE9?"
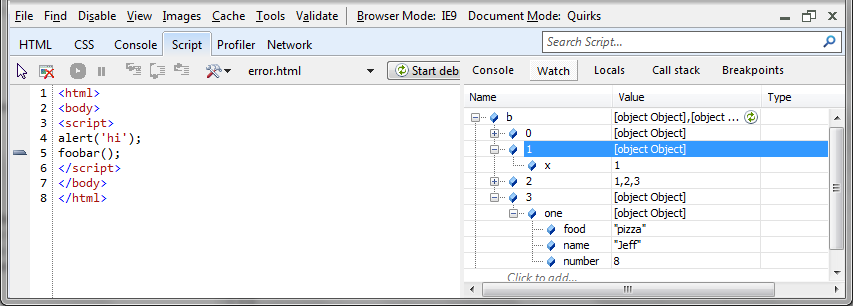
Apparently, I dare not say it, because when I put in something a bit more complex, it doesn't work. Here's what I put in:
b = [ a, {x:1}, [1,2,3], { one: a} ]
and here's what appeared in the console:
[object Object],[object Object],1,2,3,[object Object] {
	0 : [object Object],
	1 : [object Object],
	2 : 1,2,3,
	3 : [object Object]
}
And there's no way to click on those [object Object] lines and drill down to see what they are. This display is basically useless. So take that one point away from IE9. What I'd like to do is quickly inspect sthe whole variable. That's easy in Firebug. You just type the name of the variable and press Enter, and there it is for you. It's not in a nice JavaScript-ready format, but you can click down into it and see everything. You can't do that here in IE9. But all is not lost; I can add the variable to the watch tab, where I can expand its members similar to the way I can in Firebug:
That's an extra step, I suppose, but it's not bad, and it works quite well, actually. But that got me thinking: Was that feature available already in IE8, and perhaps I was just being unfair to IE8? Well, sort of, but not really. There was a Watch feature in IE8, but the only way to use it was to turn on debugging and start stepping through your scripts. Here, in IE9, you don't have to be stepping through a script to access this feature. You can just use it any time. So that's is a welcome addition to IE9. Still, it would be nice if I could inspect the variable in its entirety without having to add it to the Watch window. (The Watch window is common in most debuggers and it appears that instead of giving us a full-fledged object inspector right in the console the way Firebug does it, Microsoft took the easy step and made the Watch window available at all times, even when you're not debugging the code.)
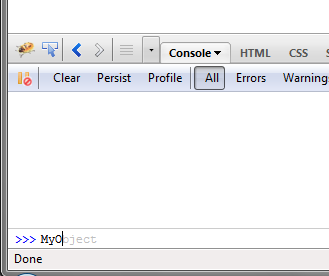
Next, one nice feature with recent versions of Firebug is the autocomplete feature. As you're typing, Firebug is aware of all the variable and identifier names in the current scope, and will do an autocomplete. In this example, I have a variable called MyObject, which holds an object. As I start typing MyO, you can see that Firebug is offering a suggestion:
You select the suggestion by pressing Enter. And in the case of objects, when I type a dot, I see a list of the members pop up, which I can scroll through and select. This is a great feature that you usually find in better IDEs.
I loaded the same html file into IE9 and ... nope. As I typed MyObject, no popups appeared, no autosuggest, nothing. Bummer. Deduct from IE9. (And for what it's worth, Chrome's console also offers an autocomplete.)
So where do we stand on the console? I'll say it's decent. Not great, but not bad. It's definitely an improvement from IE8. But it still has a ways to go to meet up with the power of Firebug's console.What Else Does F12 Developer Tools Offer?
Well, here's where we're at: The console is definitely better, but still not quite as good as Firebug's. Inspecting variables is kind of difficult, for example. And many of the features in the tools are just the same as IE8's Developer Toolbar and aren't actually new with IE9 (including letting you press F12, although that's not exactly a feature to write home about). And as for the annoying message that stopped scripts from running, that went away when I told IE9 to allow it, and it even stayed away when I loaded a new page. That problem seems to be solved. (The message does re-appear when you re-start IE9, but in one click it's gone, and with no popup.) So what is new besides the slight improvement to the console and the partial removal of the warning about scripts?
Well, one important feature I use a lot in Firebug is the inspector, where I can click a little arrow, and then go up into the browser itself, click on an element, and then see where that element is in the DOM.
And IE9's Developer Tools has that feature. And it works well. But guess what! That feature already existed in IE8's developer toolbar. (And maybe IE7 for all I know, but I don't have an IE7 sitting around here to test.) Hm. This is getting interesting indeed, as I'm discovering a couple things that might require me to get professional therapy over:
1. IE8's Developer Toolbar had some good features after all. I just didn't realize they existed until now when I tried IE9's developer features.
2. What caught my attention and led me to try out the new developer features in IE9 was the "F12" marketing campaign -- even though you could previously access the developer toolbar in IE8 with F12.
Go figure.
And there are several other features that I actually did know about that existed in earlier versions and still do, such as the debugger itself, where you can set breakpoints and trace through your code. That part works pretty well and has for some time.
But what about actual new features in this thing beside the mild improvements to the console? Are there really any? Well, there's now a Network Traffic tab that wasn't in earlier versions. Before looking at it, let me say that Firebug has a pretty nice network tab as well, which shows the times and other information about all the items downloaded when you load a page.
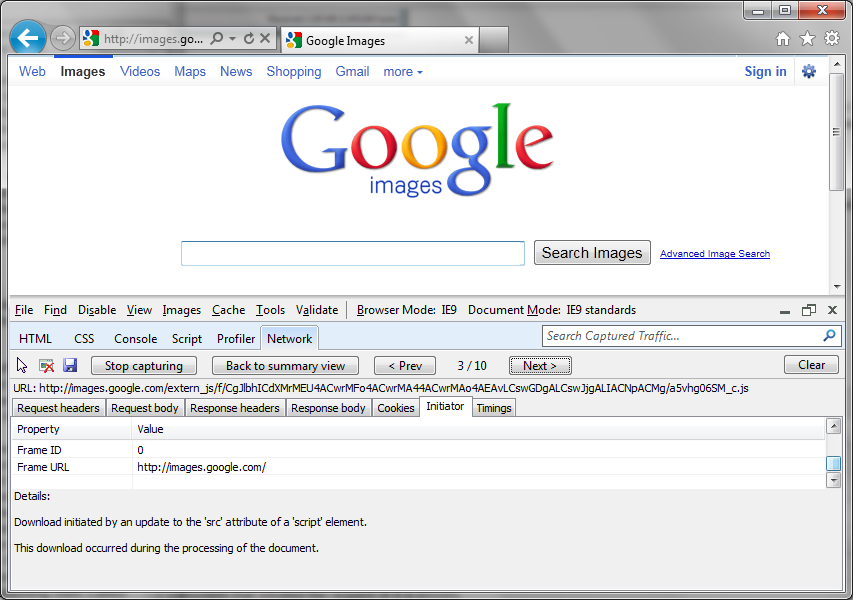
It turns out the IE9's Network Traffic tab and Firebug's Network tab are very similar. They list all the requests in a grid, including the network response (such as 200, or 404, and so on). Firebug lets you expand each request and see both the request headers and the response headers. IE9 also lets you expand the items, and also shows the request and response headers. But IE9 also shows request body and response body, whereas Firebug does not. That might be a useful feature. Also, IE9 has a column for type (such as "text/html" or "text/javascript"), whereas Firebug has that information in the expandable headers instead. And when you expand a request in IE9, you also see cookies that were set, as well as an interesting item called Initiator:
This is kind cool, as it shows you where the request came from. I can imagine scenarios where I would need to know that information, especially during Ajax calls. And this isn't available in Firebug. (It's possible this information is available in Firefox, perhaps as another add-in outside of Firebug, or maybe Firebug has it and I'm missing it. If you know of such a place, feel free to add a comment about it after this article. I know there's another add-in I use for Firefox called Live Headers, but this one also doesn't show any kind of initiatior information, at least not that I can find. Again, comment if I'm wrong.) Here's where you can learn more about IE9's network traffic feature.
But development life in Firefox isn't all about Firebug. There are a few other addins I that use quite a bit, one being the aformentioned Live Headers. Another is called Web Developer, and yet another is called User Agent Switcher. (You can find both at https://addons.mozilla.org/en-us/firefox/user/45/ . They're both by the same guy, Chris Pederick.) These three addins provide even more capability to Firefox. Does IE9 have any of these features?
One feature in particular that I like in the Firefox Web Developer addin is the ability to look at the "generated" source code. With JavaScript, you can manipulate the DOM to your heart's content; but when you do, the resulting DOM can look considerably different from the original HTML source code. But if you view the source, you see the original HTML. With the Web Developer addin, you can view what the HTML source looks like after your JavaScript code has changed it.
IE9 has a few different options for viewing source, but alas, there's not one that views the modified DOM. Take one away from IE9's score. While this isn't a feature I use every day in Firefox, I do use it enough to consider it important.
Now what about the User Agent Switcher addin for Firefox? Does IE9 does have something similar? First, let me explain briefly what this means. When a browser connects to a web site, it identifies itself, including the type of browser it is, along with some other information. A web site can be coded to respond differently based on the type of browser. This is especially useful when create a web site that looks differently on mobile browsers versus desktop browsers. Using the addin in Firefox, you can choose your user agent string. And, indeed, in IE9, you can do the same thing. (If you're trying it out at home, click the Tools menu in the F12 Developer Tools, and then Change User Agent String. You can select from a list, or type in your own. Good deal. (And incidentally, this feature didn't exist in IE8's Developer Toolbar, so this feature really is new and good.)
That actually sums up the new features Microsoft lists for us, except for one. This one feature I haven't touched on, and I'm not going to, because it will require an article in and of itself: Performance Measuring. Microsoft is in the process of building some tools for measuring a web site's performance. This is an interesting area, and there are various tools for all the browser regarding measuring performance. And from what I've heard, it appears the feature isn't quite complete yet. You can see a very brief mention of it here .
Wrapping it Up
So the big question: Will I leave Firebug and embrace IE9 instead? No chance. The biggest reason is that the console in Firebug is still way ahead of IE9's console. However, that's not to say I won't use IE. When developing a web site, I have to test it on different browsers to make sure I don't encounter any problems. And that's when I'll use IE9, just as I used IE8 in the past (and IE7 and, heaven forbid, IE6...). So I'm definitely going to make sure I have IE9 available on my machine. But I won't be giving up Firebug just yet. Microsoft still has a long way to go on this one.