Hi,

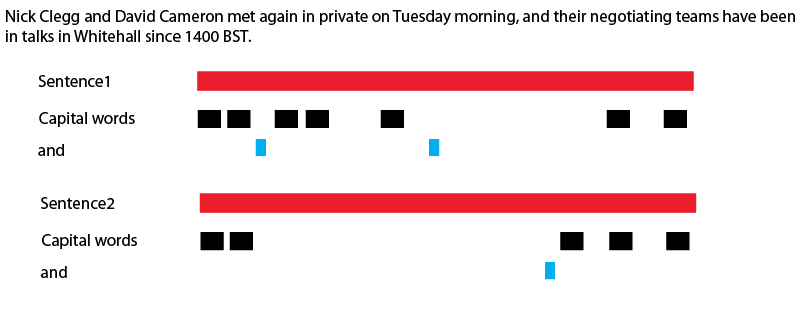
What I want to do is, to take multiple sentences, and create a bar representing the sentence length, and under that bars for words, or string of interest. And this process will be iterated over a text, so I can get many graphs on top of each other representing a paragraph, or a text. To explain better, I made one by hand, (attached ).
I know that I can use functions like len(), index = str.find('query') to get the data I need for that graph, but I do not know how to put it into graphs. I checked out matplotlib, which is a bit complicated for me. I wonder if there is an easier way of doing this.

Thanks a lot.

Recommended Answers

All 6 Replies

I checked out matplotlib, which is a bit complicated for me.

Hey, the first time is always complicated but in reality matplotlib is fairly easy to use. The problem is picking what to use. Herewith an example more or less like the chart you want, in under 50 lines of code.

Of course, you will need to calculate where to plot the rectangles but you should be able to riff off this. Just remember that axhspan() takes your axis units (20->0 in this case) for the Y-values but internal units (always 0->1) for the X-values, and you'll be OK.

import matplotlib
import pylab

if __name__ == '__main__':
    pylab.rcParams['figure.figsize']       = [12.0, 7.0]
    pylab.rcParams['figure.subplot.left']  = 0.12 # Left margin
    pylab.rcParams['figure.subplot.right'] = 1.0-0.08 # Right margin

    # Axes range from 0 to 1 for x-axis (simplifying calls to .axhspan()) and 
    # 20 down to 0 for Y-values because that's convenient for this example

    ax = [0, 1,   20, 0] # [xlo, xhi,   ylo, yhi]

    # First sentence:

    # Red rectangle for the full sentence ... from y=1 to y=2, all the way across

    matplotlib.pyplot.axhspan(1, 2, xmin=0, xmax=1, ec='k', fc='r')
    pylab.text(-0.12, 1.7, "Sentences")

    # Black rectangle for the caps

    matplotlib.pyplot.axhspan(3, 4, xmin=0.12, xmax=0.14, ec='k', fc='k')
    matplotlib.pyplot.axhspan(3, 4, xmin=0.16, xmax=0.19, ec='k', fc='k')
    matplotlib.pyplot.axhspan(3, 4, xmin=0.42, xmax=0.45, ec='k', fc='k')
    pylab.text(-0.12, 3.7, "Capital words")

    matplotlib.pyplot.axhspan(5, 6, xmin=0.13, xmax=0.14, ec='k', fc='#3355CC')
    matplotlib.pyplot.axhspan(5, 6, xmin=0.18, xmax=0.19, ec='k', fc='#3355CC')
    matplotlib.pyplot.axhspan(5, 6, xmin=0.40, xmax=0.41, ec='k', fc='#3355CC')
    matplotlib.pyplot.axhspan(5, 6, xmin=0.64, xmax=0.65, ec='k', fc='#3355CC')
    matplotlib.pyplot.axhspan(5, 6, xmin=0.77, xmax=0.78, ec='k', fc='#3355CC')
    pylab.text(-0.12, 5.7, "and")

    # Second sentence

    pylab.text(-0.12,  9.7,  "Sentence 2")
    # Fill in your own data
    pylab.text(-0.12, 11.7, "Capitals 2")
    # Fill in your own data
    pylab.text(-0.12, 13.7, "and 2")
    # Fill in your own data

    pylab.axis(ax)
    matplotlib.pyplot.title("Analysis")
    matplotlib.pyplot.xticks((),()) # No labels for X-axis
    matplotlib.pyplot.yticks((),()) # No labels for Y-axis
    pylab.show()
commented: Nice code to get to know this unknown to me module +1

Looks promising, BearofNH, I will study that code for myself.

If you want to go the DIY way, maybe you can check up my histogram program (http://www.daniweb.com/forums/post1183655.html#post1183655) with turtle graphics (kind of cute, but probably not the most efficient way) or put the objects in Tkinter Canvas proper way, even with right Labels packed OK, could fulfil your basic needs.

thanks a lot BearofNH.
I used matplotlib, and wanted to post the final version I got, it works.

text ='''World number two Nadal breezed through the first set, taking it with breaks of serve in the fourth and sixth games.
Monfils put up more resistance in an erratic second set but his wayward display was summed up by a double fault which sealed Nadal's victory.
The Spaniard will face a semi-final against compatriot Nicolas Almagro, who beat Austrian Juergen Melzer 6-3 6-1.
In the women's competition, fourth seed Venus Williams booked her place in the semi-finals with a 6-3 6-3 win over Australia's Samantha Stosur.'''
import pylab
import matplotlib


# Put text into list of sentences            
sentences = []
sentences = text.split('\n')

# Get the lenght of longest sentence-Lmax and number of sentences
Lmax=0
it = 0
for i in sentences:
      it = it + 1
      LenSen= len(i)
      if LenSen > Lmax:
            Lmax = LenSen
totalnumber = it

#Set the image properties
pylab.rcParams['figure.figsize']       = [Lmax/20, totalnumber]
pylab.rcParams['figure.subplot.left']  = 0.2 # Left margin
pylab.rcParams['figure.subplot.right'] = 1.0-0.04 # Right margin
pylab.rcParams['font.size'] = 7

# Axes range from 0 to 1 for x-axis (simplifying calls to .axhspan()) and 
# 20 down to 0 for Y-values because that's convenient for this example
ax = [0, 1, totalnumber+1, 0] # [xlo, xhi,   ylo, yhi]


# printer is a drawing module
def printer(searchterm, Input,start,end,xstart,color):
      lens = len(searchterm)
      while True:
             inDex = Input.find(searchterm, start,end)
             if inDex == -1:
                   break
             inDex = float(inDex)
             inDS=inDex/Lmax
             inDE=(inDex+lens)/Lmax
             matplotlib.pyplot.axhspan(it+xstart,it+0.2+xstart, xmin=inDS, xmax=inDE, ec='k', fc=color)
             # if search string not found, find() returns -1
             # search is complete, break out of the while loop

             # move to next possible start position
             inDex= int(inDex)
             start = inDex + 1
it=0      
for i in sentences:
      it = it+1
      LenSen= len(i)
      LenF = float(LenSen)
      matplotlib.pyplot.axhspan(it+0.2,it+0.4, xmin=0, xmax=LenF/Lmax, ec='k', fc='r') #creates sentence bar
      pylab.text(-0.2, it+0.4, 'sentence'+str(it)+' with spaces') # create the sentence bar 
      printer(' ', i, 1, LenSen,0.2,'b')    #blue represents the spaces on sentence bar
      printer('the', i, 1, LenSen,0,'y') #above sentence bar, yellow represents 'the'
      pylab.text(-0.2, it+0.2, 'the')


pylab.axis(ax)
matplotlib.pyplot.title("Analysis")

matplotlib.pyplot.xticks((),()) # No labels for X-axis
matplotlib.pyplot.yticks((),()) # No labels for Y-axis
pylab.show()

I have couple of more questions
Is it possible to turn rectangles to ellipses, it might look better that way.
and can I store output as pdf or smth like that.

thanks a lot

You can just click the floppy image and one supported format is pdf.

I think your font is very small. The beginning part of your code I would write:

# Put text into list of sentences            
sentences = text.split('\n')

# Get the lenght of longest sentence-Lmax and number of sentences

Lmax=max([len(x) for x in sentences])

totalnumber=len(sentences)

Very nice.

Sadly, matplotlib doesn't have native support for ellipses, at least not that I'm aware of. I suppose you can search for the right keywords, but it may be a bit harder than what you've got so far.

If you include (say) pylab.savefig("MyFile") # Creates MyFile.png just before the pylab.show() line, matplotlib will save your plot as a .png file. I don't think any other formats are available, but there are a number of general utilities to convert file formats.

I did here adaptation from my histogram program, as I mentioned. Maybe for that it is eacier to change the function to make ellipses, use picture file stretched or something. Probably most flexible version would have been Tkinter solution with Canvas or Labels. The forum does not seem to understant ''' so I changed it to """

I did not think it necessary to color the picked up words from main sentence line, but it is easy to add second square paint for those if needed.

This square function is producing rectangles and so on. But what a heck, word choices can clean up later. This looks working for me.

from turtle import *
text = """World number two Nadal breezed through the first set, taking it with breaks of serve in the fourth and sixth games.
Monfils put up more resistance in an erratic second set but his wayward display was summed up by a double fault which sealed Nadal's victory.
The Spaniard will face a semi-final against compatriot Nicolas Almagro, who beat Austrian Juergen Melzer 6-3 6-1.
In the women's competition, fourth seed Venus Williams booked her place in the semi-finals with a 6-3 6-3 win over Australia's Samantha Stosur."""

def square(c,d,col,side):
    color(col)
    fill(not side)
    forward(d)
    left(90)
    if side:
        up()
        forward(thickness)
        down()
        fill(True)
    forward(thickness)
    left(90)
    forward(d)
    left(90)

    if side:
        up()
        forward(thickness)
        down()
        fill(False)
      
    forward(thickness)
    left(90)

    fill(False)
    side=False
    ## move until after current word painting black line
    color('black')
    forward(d)
    
# Put text into list of sentences            
sentences = [w.rstrip() for w in text.split('\n')]

# Get the lenght of longest sentence-Lmax and number of sentences
lenw=[len(x) for x in sentences]
Lmax=max(lenw)
totalnumber=len(sentences)

## Title
setup(width=1000, height=600, startx=0, starty=0)
delay(0)
hideturtle()

words=(('the','yellow'),('a','green'))
ws=', '.join([x for x,y in words])

up()
goto(-100,250)
down()
write("Analysis",font=('Arial',24))
margin = 200
thickness=20

leftside = -window_width() // 2 + margin // 10
bartitles=((ws, 'Sentence '+str(i+1)+' with spaces') for i in range(len(sentences)))
barstart = leftside + margin
for i,t in enumerate(bartitles):
    up()
    goto(leftside, 195-thickness*4*i )
    down()
    write(t[0]+'\n\n'+t[1])

up()
goto(barstart,200)
width=window_width()-margin-50

for i in sentences:
      lensen=len(i)
      w= width//lensen
      wcol=['red','blue']
      pencolor('black')

      wordsinsentence=i.split()
      for j in wordsinsentence:
            side=False
      
            down()
            for i in words:
                wd,c=i
                if wd==j:
                    side=True
                    col=c
                    print wd
                    break

            for c,d in enumerate([len(j)*w,w]): ## word and following space
                  print c,d,'\t',
                  if j[-1]=='.' and d==w:
                      print 'Break'
                      break        ## no space in the end
                  if not side : col=wcol[c]
                      
                  square(c,d,col,side)
                  side = False
      up()
      goto(barstart,ycor()-4*thickness)
done()
commented: nice code +2
Be a part of the DaniWeb community

We're a friendly, industry-focused community of developers, IT pros, digital marketers, and technology enthusiasts meeting, networking, learning, and sharing knowledge.