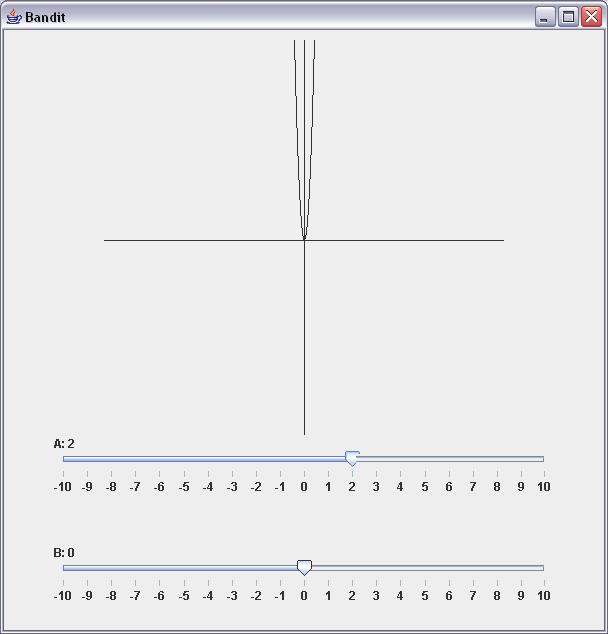
Design and implement a simple GUI application (or applet) that displays the graph of a quadratic function, Ax2 + Bx. Below the plot should be two sliders which allow the user to interactively set the values of A & B, the display being updated continuously in response to any changes the user makes to the sliders.
this is my assignment i wrote some code but the graph doesnt move when i moved sliders can you help me?
Here is my code

import java.awt.*;
import java.awt.event.*;
import javax.swing.*;
import javax.swing.event.*;
import java.util.*;
 
public class PlotLuckPanel extends JPanel
{
 	protected JPanel controls, graph, general;
 	protected JSlider aSlider, bSlider;
 	protected JLabel aLabel, bLabel;
  	int a, b;
  	
 	public PlotLuckPanel()
 	{
 		setLayout(new FlowLayout());
 		
 		setPreferredSize( new Dimension( 500, 500));
 		
 		aSlider = new JSlider( JSlider.HORIZONTAL, -100, 100, 0); 
 		bSlider = new JSlider( JSlider.HORIZONTAL, -100, 100, 0); 
 		
 		aSlider.setMajorTickSpacing(25);
 		aSlider.setMinorTickSpacing(5);
 		aSlider.setPaintTicks(true);
 		aSlider.setPaintLabels(true);
 		aSlider.setAlignmentX( Component.LEFT_ALIGNMENT);
 		
 		bSlider.setMajorTickSpacing(25);
 		bSlider.setMinorTickSpacing(5);
 		bSlider.setPaintTicks(true);
 		bSlider.setPaintLabels(true);
 		bSlider.setAlignmentX( Component.LEFT_ALIGNMENT);
 		
 		PlotLuckListener listener = new PlotLuckListener();
 		aSlider.addChangeListener( listener);
 		bSlider.addChangeListener( listener);
 		
 		a = aSlider.getValue();
 		b = bSlider.getValue();
 		
 		aLabel = new JLabel( "A");
 		bLabel = new JLabel( "B");
 		aLabel.setAlignmentX( Component.LEFT_ALIGNMENT);
 		bLabel.setAlignmentX( Component.LEFT_ALIGNMENT);
 		
 		controls = new JPanel();
 		controls.setLayout( new BoxLayout( controls, BoxLayout.Y_AXIS));
 		controls.add( aLabel);
 		controls.add( aSlider);
 		controls.add( Box.createRigidArea( new Dimension(0,30)));
 		controls.add( bLabel);
 		controls.add( bSlider);
 		
 		add(controls);
 		
 		graph = new JPanel();
 		graph.setPreferredSize( new Dimension( 250, 250));
 		graph.add(new Draw());
 		
 		 				
 		general = new JPanel();
 		general.setLayout( new BorderLayout());
 		general.add( graph, BorderLayout.NORTH);
 		general.add( controls, BorderLayout.SOUTH);
 		
 		add(general);

 		
  	}
  	
 private class Draw extends JPanel
 {
 	private int x1, x2, y1, y2;
 	private int a, b;
 	
 	public Draw()
 	{
 		setPreferredSize( new Dimension (500, 300)) ;
 	}
 	
	public void paintComponent( Graphics g)
	{
		super.paintComponent( g);
		x1 = 0; x2 = 0; y1 = 0; y2 = 0;
			
		while( x1 < 1000)
		{
			x2 = x1 + 1;
			y1 = a * x1 * x1 + b * x1;
			y2 = a * x2 * x2 + b * x2;
			g.drawLine( 200 + x1, 200 - y1,200 + x2, 200 - y2 );
			g.drawLine( 200 - x1, 200 - y1,200 - x2, 200 - y2 );
			x1 = x2;	
		}
	 } 	

 } 	
  	private class PlotLuckListener implements ChangeListener
 	{ 	 
 		Draw graph = new Draw();
 		
 		public void stateChanged( ChangeEvent e)
 		{
 			aSlider.setVisible( true);
 			bSlider.setVisible( true);
 			
			a = aSlider.getValue();
			b = bSlider.getValue();
			
			aLabel.setText( "A: " + a);
			bLabel.setText( "B: " + b);
		
			repaint();
 			
 		}
 	}
 }
import java.awt.*;
import java.awt.event.*;
import javax.swing.*;
import javax.swing.event.*;
 
public class PlotLuck 
{
public static void main(String[] args) 
    {
        JFrame frame = new JFrame("Bandit");
        
        frame.setDefaultCloseOperation( JFrame.EXIT_ON_CLOSE);
        frame.getContentPane().add( new PlotLuckPanel());
        frame.pack();
        frame.setVisible(true);
    }
}

Recommended Answers

All 5 Replies

Try sticking a couple of System.out.println("step n"); type statements in the listener and the paint method so you can see when/whether they are getting called. That should help you to pinpoint where it's failing.
ps: not sure why you have a Draw graph = new Draw(); in the listener - it doesn't seem to be used for anything?

Just noticed - you declare new and b variables in the Draw class, but the listener will refer to the a and b variables in the PlotLuckPanel class. Perhaps you should delete the duplicate declaration in Draw?
(ps using code=java tags and getting the indentation right will help to see what's in what scope)

When i delete the variables in Draw it works i become happy but it works wrong:S I cant find my fault but i continue trying thnks for your help:)

When i delete the variables in Draw it works i become happy but it works wrong:S I cant find my fault but i continue trying thnks for your help:)

The slider part works fine now, it appears (though I'd have it range from -10 to 10, with ticks every 0.2 or so, rather than ranging from -100 to 100. It gets too steep too fast).

I don't see what you are trying to do here:

public void paintComponent( Graphics g)
	{
		super.paintComponent( g);
		x1 = 0; x2 = 0; y1 = 0; y2 = 0;
			
		while( x1 < 1000)
		{
			x2 = x1 + 1;
			y1 = a * x1 * x1 + b * x1;
			y2 = a * x2 * x2 + b * x2;
			g.drawLine( 200 + x1, 200 - y1,200 + x2, 200 - y2 );
			g.drawLine( 200 - x1, 200 - y1,200 - x2, 200 - y2 );
			x1 = x2;	
		}
	 }

I'm guessing your problem is that you are assuming that the vertex is located at (200, 200). At least it appears that you are assuming that in this code. That's not always going to be the case with the values you are allowing the user to choose (actually, I'm assuming that you are assuming the vertex will be at (0,0) and you are just making it (200, 200) so it fits on the screen. I'd say you have a math calculation issue, not a programming issue. If you are in fact assuming the vertex will always be (0,0) for all values of a and b, that's not true. It is true only when b equals 0. If you are not assuming that, what do the 200's above represent?

yes as you said the vertex is located at(200,200) to fit in the screen I found the mistake in my code it works but the appearance is not good enough... thanks for your help:) here is my new code of paintComponent:

public void paintComponent( Graphics g)
	{
		super.paintComponent( g);
		x1 = -51; x2 = 0; y1 = 0; y2 = 0;
		
		g.drawLine(200,600,200,0);//y axis
		g.drawLine(0,200,600,200);//x axis
			
		while( x1 < 100)
		{
			x2 = x1 + 1;
			
			y1 = a * x1 * x1 + b * x1;
			y2 = a * x2 * x2 + b * x2;
			
			g.drawLine( 200 + x1, 200 - y1,200 + x2, 200 - y2 );
			x1 ++;	
		}
	 }
Be a part of the DaniWeb community

We're a friendly, industry-focused community of developers, IT pros, digital marketers, and technology enthusiasts meeting, networking, learning, and sharing knowledge.