In my previous tutorial, I explained how I implemented heuristic approaches for finding inter-annotator agreement between three annotators.
Heuristic approaches are excellent for understanding the degree of agreement between multiple annotators. However, you should back your analysis with statistical evidence. This is where statistical techniques for inter-annotator agreement come into play.
In this tutorial, I will explain statistical approaches to find the inter-annotator agreement in Python using Pandas dataframes as annotation datasets.
The Dataset
I have already explained the dataset details in my previous tutorial. The dataset consists of 9 columns. Each column contains an emotion rank (1, 2, or 3). Three annotators annotate each dataset. The data is stored in Pandas dataframes which look like the one in the following screenshot:
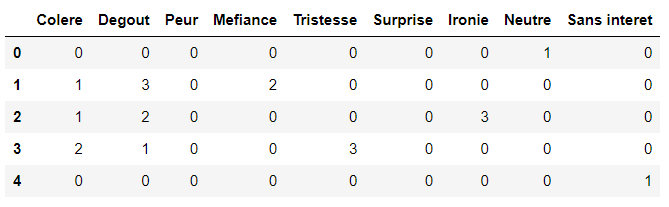
We need to find statistical measures of agreement between the three annotators.
Various statistical approaches exist for finding inter-annotator agreement between more than two annotators, e.g., Fleiss' kappa and Krippendorff's alpha.
Several Python libraries implement the aforementioned statistical approaches. These libraries allow you to find the agreement between individual lists and NumPy arrays. However, I could not find a library that would enable finding inter-annotator agreements for all the corresponding columns of multiple Pandas dataframes.
Therefore, I wrote Python functions that allow finding Fleiss’ Kappa and Krippendorff's Alpha values for corresponding columns in multiple Pandas dataframe. The functions also return mean values for the agreement between all the columns.
Finding Fleiss’ Kappa for Pandas Dataframe Columns
The Python statsmodel module provides functionalities to perform various statistical tests. Among the functions, you can use the fleiss_kappa() to find the Fleiss’ kappa values for inter-annotator agreement.
You can install the statsmodel library using the following pip command:
pip install statsmodelsThe following script implements the get_fleiss_kappa() function, which returns Fleiss’ kappa values for the corresponding columns in Pandas dataframes. The function accepts a list of Pandas dataframes where each dataframe contains annotations from one of the annotators.
Inside the function, we first iterate through all the columns in the input Pandas dataframes. During each iteration, values from the corresponding columns of the three Pandas dataframe are used to create an agreement matrix with three columns.
The data from the agreement matrix is passed to the aggregate_raters() function, which returns a matrix in shape accepted by the fleiss_kappa() function.
The get_fleiss_kappa() function returns the results dictionary, which stores the Fleiss’ kappa values for all the columns in the input Pandas dataframe.
The following script contains the implementation for the get_fleiss_kappa() function.
import statsmodels
from statsmodels.stats.inter_rater import fleiss_kappa
from statistics import mean

def get_fleiss_kappa(datasets):

    results = {}

    ## extract corresponding columns from the three datasets
    for col in datasets[0].columns:
        dataset_columns = []
        for dataset in datasets:
            dataset_columns.append(dataset[col])

        ## find fleiss kapa values for corresponding columns
        agreement_matrix = pd.concat(dataset_columns, axis = 1)
        table = statsmodels.stats.inter_rater.aggregate_raters(agreement_matrix.values)

        res = fleiss_kappa(table[0])
        results[col] = res

    ## find mean values for all columns
    results['mean'] = mean(results.values())

    return results
In the following script, we pass a list of three Pandas dataframe containing annotations to the get_fleiss_kappa() function.
We convert the dictionary returned by the get_fleiss_kappa() to a Pandas dataframe and then take its transpose to display column names and kappa values as columns.
In the output, you can see Fleiss’ Kappa values for inter-annotator agreement for all the columns in the three input dataframes.
results1 = get_fleiss_kappa([file_50_1_JC, file_50_1_HL, file_50_1_SB])
results1_df = pd.DataFrame.from_dict([results1]).T
results1_df = results1_df.reset_index()
results1_df.columns =['Emotion', 'Kappa Value']
results1_df.head(10)
Output:

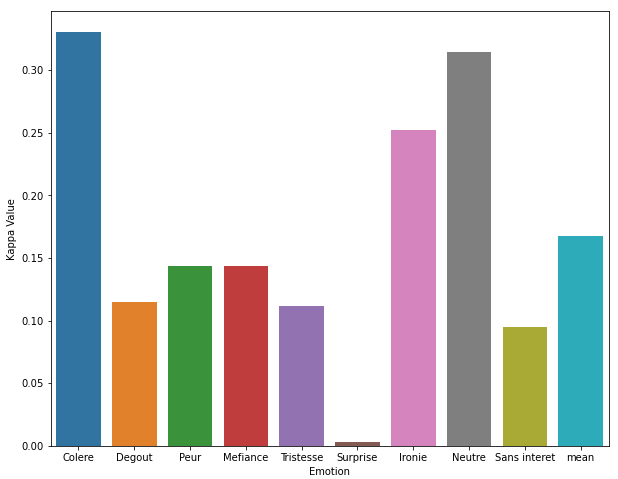
To better understand the comparison between Fleiss’ Kappa values, you can plot a bar plot for all the values in the ‘Kappa Value’ column.
The following script uses the Python Seaborn library for plotting the bar plot.
from matplotlib import pyplot as plt
import seaborn as sns

plt.figure(figsize=(10,8))
sns.barplot(data = results1_df, x= 'Emotion', y="Kappa Value")
Output
Finding Krippendorff’s Alpha for Pandas Dataframe Columns
The Python Krippendorff library implements Krippendorff’s Alpha. You can install the library with the following pip command:
pip install krippendorffThe alpha() function from the krippendorff module returns the Krippendorff’s alpha given an input matrix.
The following script implements the get_krippendorff() function that returns Krippendorf’s alpha for inter-annotator agreement between corresponding columns of two or more Pandas dataframes.
The get_krippendorf() function is quite similar to the get_fleiss_kappa() function as it accepts a list of Pandas dataframes as a parameter value and returns a dictionary containing Krippendorf Alpha values for all the corresponding columns in the list of dataframes.
The following script implements the get_krippendorf() function:
import statsmodels
from statistics import mean
import krippendorff as kd
def get_krippendorff(datasets):
results = {}
## extract corresponding columns from the three datasets
for col in datasets[0].columns:
dataset_columns = []
for dataset in datasets:
dataset_columns.append(dataset[col])
agreement_matrix = pd.concat(dataset_columns, axis = 1).T
## find fleiss kapa values for krippendorff's alpha
res = kd.alpha(agreement_matrix, level_of_measurement='nominal')
results[col] = res
## find mean values for all columns
results['mean'] = mean(results.values())
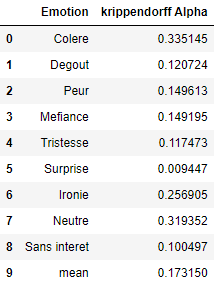
return resultsThe following script converts the values returned by the get_krippendorf() function into a Pandas dataframe:
results1 = get_krippendorff([file_50_1_JC, file_50_1_HL, file_50_1_SB])

results1_df = pd.DataFrame.from_dict([results1]).T
results1_df = results1_df.reset_index()
results1_df.columns =['Emotion', 'krippendorff Alpha']
results1_df.head(10)
Output:
Finally, as you did previously, you can plot a bar plot that shows how Krippendorf’s Alpha values compare for different columns in input Pandas dataframes.
from matplotlib import pyplot as plt
import seaborn as sns

plt.figure(figsize=(10,8))
sns.barplot(data = results1_df, x= 'Emotion', y="krippendorff Alpha")