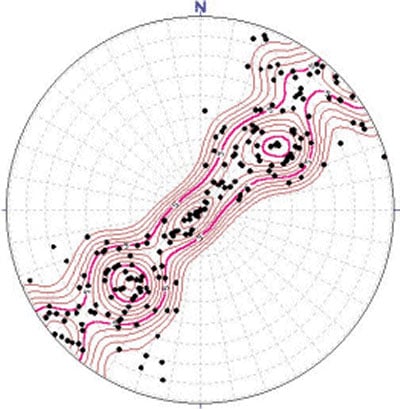
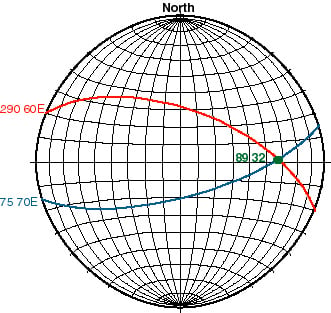
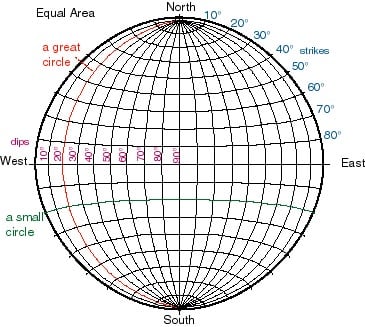
Dears, I am staring to learn python/wxpython in order to make an app aimed at structural geology analysis. As usual, I am starting with something simple, and after I get the way of it, make it more complex.

The idea is (what I have running so far): a window with two panels (created with splitterwindows), in the left panel I display the data opened from txt files and in the right panel, I intent to create graphics from the data.

The data is basically a two-column ASCII file, values separated by tab/space/comma (reading it with csv). In the first column, we have the "azimuth" (ranging 0-360 degrees) and in the second column the "dip" (ranging 0-90 degrees) of geological structures.

The graphics will be similar to those in the attached files. Note that although they _look_ like polar plots, they aren't exactly polar plots. To summarize main differences:

- regular polar plots: Data plotted as (theta, radii), where theta = 0 at East (right of plot) and increases counter-clockwise, and radii = 0 ate center of plot.

- stereonet - data plotted in Lambert Azimuthal Conformal projection (or Azimuthal Equidistant), theta (azimuth) = 0 at North and increases clockwise, and radii (dip) = 0 at the border of the plot (90 at the center).

Given the differences with regular polar plots, I belive it would be easier to use some sort of "genereal purpose" graphics approach instead of matplotlib/chaco (is it?). Also, I want to save the images to file, not only to raster formats like png or jpg but also to vector formats, like svg, pdf or eps (maybe even wmf).

So, I'd like to hear from you, what do you recommend?
Dani AI

Generated

— short, practical route: use Matplotlib plus the mplstereonet toolkit, embed the Matplotlib figure in your wx app, and export vector files with Matplotlib’s backends. mplstereonet already implements lower‑hemisphere equal‑area and equal‑angle stereonets and the strike/dip⇄plot conversions you need; Matplotlib’s savefig writes SVG/PDF/EPS, and embedding into wx is straightforward with FigureCanvasWxAgg. (mplstereonet docs, matplotlib savefig, embedding in wx example).

Minimal example (read two-column azimuth/dip, plot, save vectors):

import numpy as np
import matplotlib.pyplot as plt
import mplstereonet

strike, dip = np.loadtxt('data.txt', delimiter=',').T

fig = plt.figure()
ax = fig.add_subplot(111, projection='stereonet')  # default = equal-area
ax.pole(strike, dip, 'o')
ax.grid()
fig.savefig('stereo.svg')
fig.savefig('stereo.pdf')

As noted, if you need lower-level control over vector primitives use Cairo (it has SVG and PDF surfaces). If your GUI is Qt-based, QSvgGenerator and QPdfWriter let you paint with QPainter directly into vector files (useful if you already draw UI widgets with Qt). For interactive, high-performance GUIs consider Chaco/Enable/Kiva (more architecture to learn but powerful). (Cairo surfaces, QSvgGenerator, QPdfWriter, Chaco docs).

One important note on projection and export: structural geology commonly uses Schmidt (Lambert azimuthal equal‑area) or Wulff (equal‑angle) nets — check which your field convention uses (Schmidt = equal‑area lower hemisphere; azimuth 000/N at top and usually plotted clockwise). Also test vector exports for fonts/line joins: Matplotlib rcParams like svg.fonttype and pdf.fonttype control font embedding/paths. (Lambert equal‑area / Schmidt net overview, matplotlib fonts/export rcParams).

QT (pyQT) can do svg files, I believe. Cairo (pyCairo) can also. The former is a GUI framework will the latter is a graphics library.

EDIT: nevermind; I don't think QT can save svg files. I know cairo can render to pdf and svg files though.

Be a part of the DaniWeb community

We're a friendly, industry-focused community of developers, IT pros, digital marketers, and technology enthusiasts meeting, networking, learning, and sharing knowledge.