Using Python with pylab included, I have created a plot. In the plot's title, I am including a variable from the program. I save the plot as a ps and every thing looks great.

However, when I try to print the document to paper or to a pdf, the numbers disappear. Any idea why this happens and how I can avoid it?

If I save the file as a pdf first, the number are still visible when printed. However, ubuntu is forcing me to print the graph in landscape mode when I would prefer portrait.

Here is the relevant section of code:

legend()

axis([0,1,0,4])

xlabel('x')

ylabel('u')

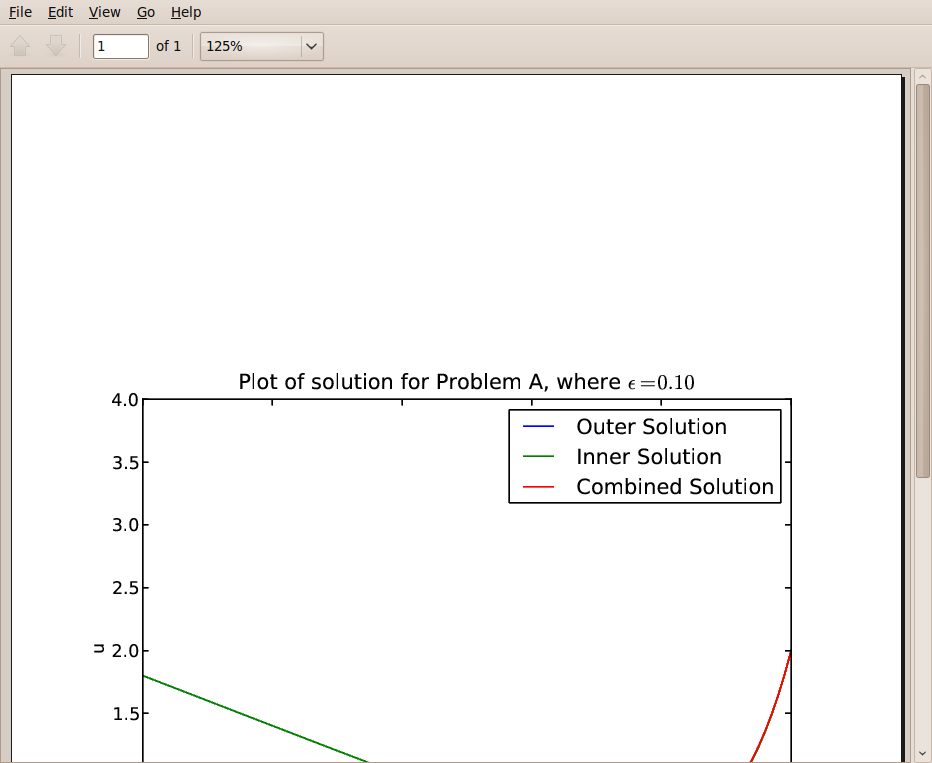
title('Plot of solution for Problem A, where $\epsilon$ = %.2f' % epsilon)


savefig('vf_hw_04_prob_01_plot.ps')
show()

Recommended Answers

All 5 Replies

On my computer (mandriva linux 2010), the number is not lost when I save as .ps or .pdf.

On my computer (mandriva linux 2010), the number is not lost when I save as .ps or .pdf.

Ok, thanks Gribouillis. I guess the issue isn't with python, but with the pdf/paper printer.

Two possibles would be to change
%.2f
to %3.2f which can mean a total of 3 bytes, one before and two after the decimal. If your OS interprets this way, then you originally have zero bytes allocated to the float. Second, omit the epsilon an see if the numbers print OK, i.e. the epsilon is overlaying the number (note the equal sign is missing as well).

I tried just having '.10' hardcoded, but still had the same problem. (i.e. numbers are present when "savefig"-ing as ps or pdf separately, however if I save as ps and then print I lose the number.)

I'll try using "%3.2f" directly. Thank you.

I tried just having '.10' hardcoded, but still had the same problem.

Which says you are overlaying it with something else, or the epsilon is pushing it off the page. If you are saving as postscript and not encapsulated postscript it is pretty easy to read the code as it is just a markup language.

Edit: From what I can tell you have a problem at the epsilon figure. It would depend on the font and the UTF that you are using. Epsilon, of course, would not be included in a normal English font, so you may have to draw it yourself as it is a fairly simple figure.

Be a part of the DaniWeb community

We're a friendly, industry-focused community of developers, IT pros, digital marketers, and technology enthusiasts meeting, networking, learning, and sharing knowledge.