Hai all...
I want to get different colored bars for labels 'Bill', 'Fred', 'Mary', 'Sue'
can any one please tell me ...as soon as possible.....
#!/usr/bin/env python
"""
The new ticker code was designed to explicity support user customized
ticking. The documentation
http://matplotlib.sourceforge.net/matplotlib.ticker.html details this
process. That code defines a lot of preset tickers but was primarily
designed to be user extensible.
In this example a user defined function is used to format the ticks in
millions of dollars on the y axis
"""
from matplotlib.ticker import FuncFormatter
from pylab import *
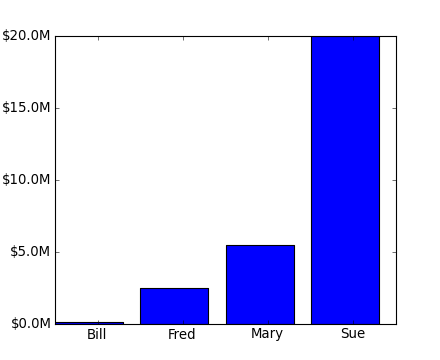
x = arange(4)
money = [1.5e5, 2.5e6, 5.5e6, 2.0e7]
def millions(x, pos):
'The two args are the value and tick position'
return '$%1.1fM' % (x*1e-6)
formatter = FuncFormatter(millions)
ax = subplot(111)
ax.yaxis.set_major_formatter(formatter)
bar(x, money)
xticks( x + 0.5, ('Bill', 'Fred', 'Mary', 'Sue') )
show()