i have written a program in tkinter to draw stock graph,there are two strange thing i can't understand
the attachment is 'AAU' data file(attachment 1).when you download it ,please save it in /tmp/AAU
there is a scrolled canvas in it ,
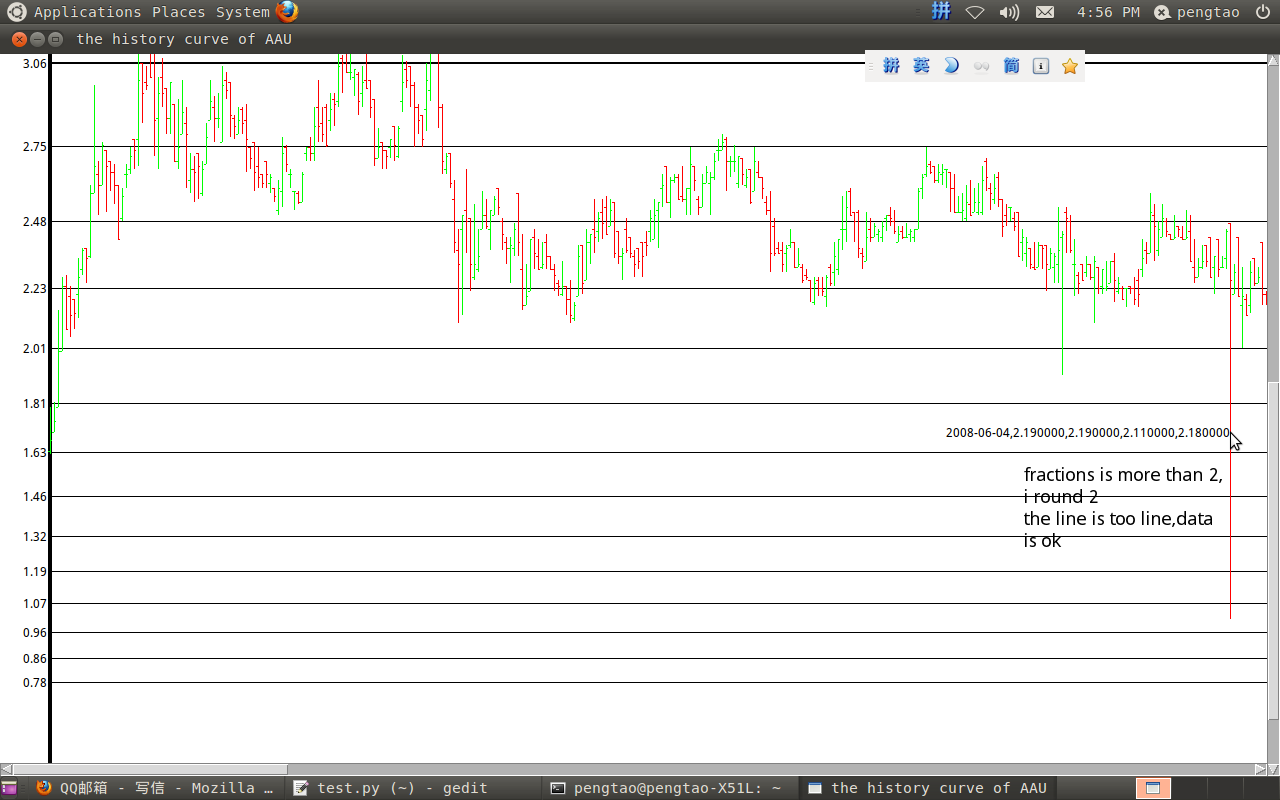
1.strang long line,please see my attachment.
i have see my data ,my formulation ,no wrong,but the line is so long!!
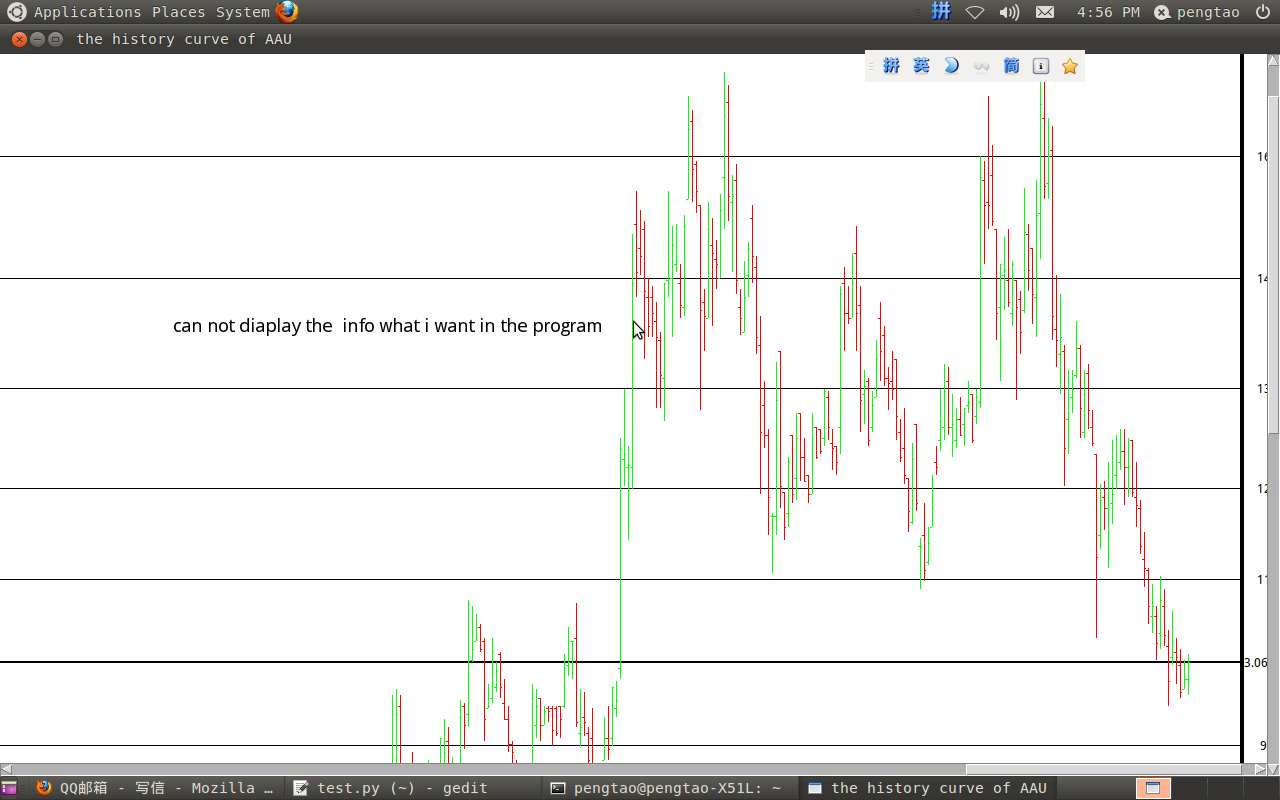
2.there is no motion event reaction in the right of canvas,only motion event reaction in the left of canvas.
3.i have round function ,but the output is still more fractions than 2.
#coding:utf-8
from Tkinter import *
import string

class  hdraw(object):
    def  __init__(self,fname):
        file='/tmp/'+fname
        self.stock=fname
        self.data=(open(file,'r').readlines())[1:-1]
        self.data.reverse()
        self.xsqueen=range(0,len(self.data)*2,2)
        self.pairs=len(self.data)
        #Open,High,Low,Close,Volume,Adj Close
        self.date         =[i.split(',')[0]   for  i  in  self.data]
        self.open         =[string.atof(i.split(',')[1])  for  i  in  self.data]
        self.high         =[string.atof(i.split(',')[2])  for  i  in  self.data]
        self.low          =[string.atof(i.split(',')[3])  for  i  in  self.data]
        self.close        =[string.atof(i.split(',')[4])  for  i  in  self.data]
        self.vol          =[string.atof(i.split(',')[5])  for  i  in  self.data]
        self.adjclose     =[string.atof(i.split(',')[6])  for  i  in  self.data]
        self.ymax         =max(self.open+self.high+self.low+self.close)
        self.ymin         =min(self.open+self.high+self.low+self.close)
        self.width        =self.pairs*4
        times=self.ymax//self.ymin+1
        if  times  < 5:
            self.height=times*180
        elif   5<= times  <10:
            self.height=times*100
        elif    10 <= times  <20:
            self.height=times*80
        else:
            self.height=times*50


    def  getyposition(self,p):
        yp=(50+self.height)-(p-self.ymin)*self.height/(self.ymax-self.ymin)
        return yp

    def  getxposition(self,x):
        xp=50+4*x
        return  xp

    def myprint(self,event):
        # convert the event coordinates to canvas coordinates
        x = canv.canvasx(event.x)
        y = canv.canvasy(event.y)
        # find the poistion in the top right corner of your canvas widget
        # less a little bit so as to see the displayed text
        if  x  in  self.xsqueen :
            ith=self.xsqueen.index(x)

             # delete previous displayed text
            canv.delete('coords')

            # display the coordinates
            canv.create_text(x,y,anchor=E,text='%s,%f,%f,%f,%f' % (self.date[ith],   \
            round(self.open[ith],2),round(self.high[ith],2),round(self.low[ith],2)   \
            ,round(self.close[ith],2)),tags='coords')


    def  drawcanvas(self):
        global  canv
        print  self.stock
        root.title('the history curve of %s'  %  self.stock)
        canv = Canvas(root, bg='white', relief=SUNKEN)
        canv.config(width=self.width+180,height=self.height+100)
        canv.config(scrollregion=(0,0,self.width+180,self.height+100))
        canv.config(highlightthickness=0)
        ybar = Scrollbar(root)
        xbar=Scrollbar(root,orient='horizontal')
        ybar.config(command=canv.yview)
        xbar.config(command=canv.xview)
        canv.config(yscrollcommand=ybar.set)
        canv.config(xscrollcommand=xbar.set)
        ybar.pack(side=RIGHT, fill=Y)
        xbar.pack(side=BOTTOM,fill=X)
        canv.pack(side=LEFT, expand=YES, fill=BOTH)
        canv.create_text(20,20,text=self.stock)
        # display the coordinates
        canv.create_line(50,self.height+50,self.width+100,self.height+50,width=4)
        canv.create_line(50,self.height+50,50,0,width=4)
        canv.create_line(100+self.width,self.height+50,100+self.width,0,width=4)
        canv.create_line(50,self.getyposition(self.ymax),self.width+100,   \
                          self.getyposition(self.ymax),width=4)
        #the last day line
        yyp=self.getyposition(self.close[-1])
        canv.create_line(50,yyp,100+self.width,yyp,width=2)
        #right  coordinates
        canv.create_text(135+self.width,yyp,text=str(self.close[-1])+'    '+'100%')
        #left  coordinates
        canv.create_text(35,yyp,text=str(self.close[-1]))
        #x  coordinates
        for i in range(0,self.pairs,20):
            canv.create_text(50+2*i,self.height+50,text=(self.date[i])   \
                       .split('-')[1],anchor=N)
        for i in range(0,self.pairs,120):
             canv.create_text(50+2*i,self.height+65,text=(self.date[i])   \
                       .split('-')[0],anchor=N)

        #draw  data
        p=self.close[-1]
        c=100
        while  p*1.1<self.ymax:
            c=c*1.1
            p=p*1.1
            yp=self.getyposition(p)
            canv.create_text(135+self.width,yp,text=str(round(c))+'%')
            canv.create_text(35,yp,text=str(round(p,2)))
            canv.create_line(50,yp,100+self.width,yp)

        p=self.close[-1]
        c=100
        while  p*0.9>self.ymin  and  c*0.9>25:
                c=c*0.9
                p=p*0.9
                yp=self.getyposition(p)
                canv.create_text(135+self.width,yp,text=str(round(c))+'%')
                canv.create_text(35,yp,text=str(round(p,2)))
                canv.create_line(50,yp,100+self.width,yp)

        #max price line
        canv.create_text(35,self.getyposition(self.ymax),text=str(self.ymax))
        #min price line
        canv.create_text(35,self.getyposition(self.ymin),text=str(self.ymin))

        canv.bind("<Motion>",self.myprint)
        for i in range(0,self.pairs):
            if  self.close[i]  >=  self.open[i] :
                colour='green'
            else:
                colour='red'
            #draw  k  line
            x1=self.getxposition(i)
            y1=self.getyposition(self.open[i])
            x2=x1
            y2=self.getyposition(self.high[i])
            x3=x1
            y3=self.getyposition(self.low[i])
            x4=x1
            y4=self.getyposition(self.close[i])
            canv.create_line(x2,y2,x3,y3,fill=colour)
            canv.create_line(x1-2,y1,x1,y1,fill=colour)
            canv.create_line(x1,y4,x1+2,y4,fill=colour)


root = Tk()
s=hdraw('AAU')
s.drawcanvas()
root.mainloop()