
hi everyone,
I'm to some extent beginner in java.
first of all let me explain a bit about our project and then I will explain the problem.
In our project there are Agent programs sending their Data via UDP connections to the Server program, Server performs some math on data, storing them if necessary, logs data to a oracle db and then forwards it to the Monitoring program through a TCP connection. we have implemented our own protocol and data are sent in definite packets. Each agent sends special packets called signal to the server so server can recognize either agents are alive or dead. The problem is in the Server Program.
I get OutOfMemoryError in server. When server receives a packet, opens a thread for handling it! I'm almost sure that I make all the objects null after using them, also right before the thread is finished I call system.gc(). Even I have a separate thread- called WatchDog- which calls gc in definite time intervals. But I see my used heap is increasing over the time. also I have seen interesting results in NetBeans Profilers!
Take a look at my Heap history in NetBeans Profiler: "You can also find all images in attachments"
http://soheil.jahangiri.googlepages.com/memory-heap.png
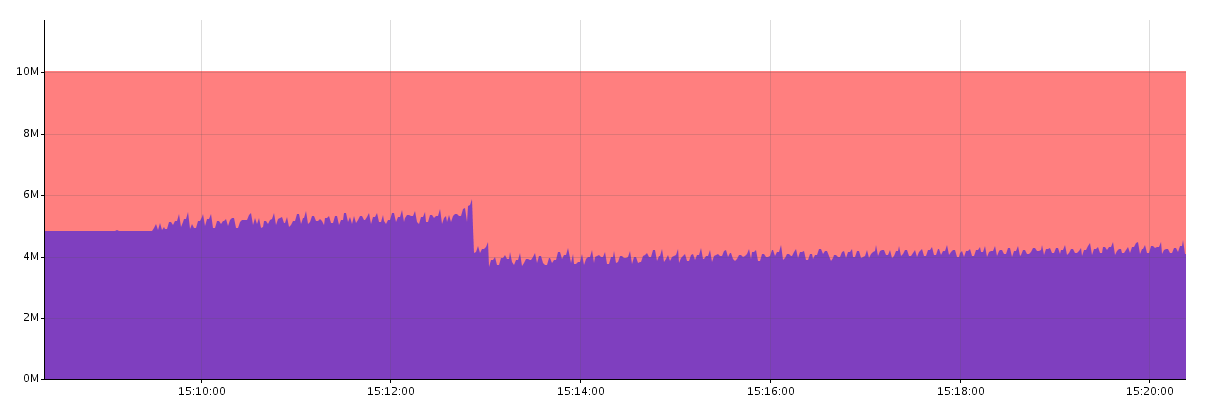
I took 2 snapshots at 15:09':05" and 15:13':53". as you see in heap history image there is a difference of about 1 Mb in these 2 points.
1st: why the memory suddenly got free between these points such that it didn't happen again?!!
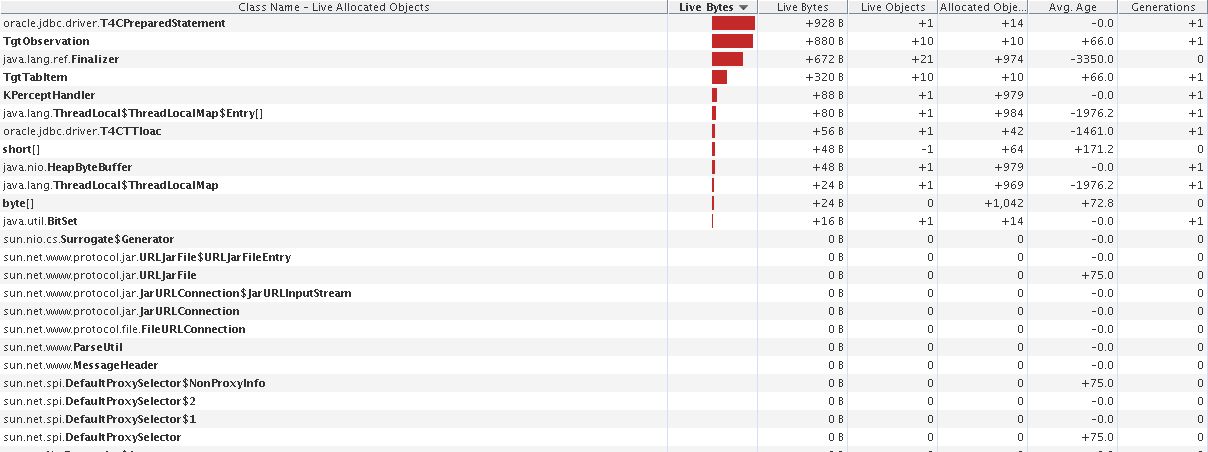
2nd: I computed the memory difference of 2 snapshots with profiler, so the sum of live bytes in difference memory should be about 1Mb. but it is NOT!
Here is an image of the difference. first image is the top rows and the second one is the bottom rows. live bytes of objects between these rows are 0 Mb.
First Image: Top rows of difference
http://soheil.jahangiri.googlepages.com/difference.png
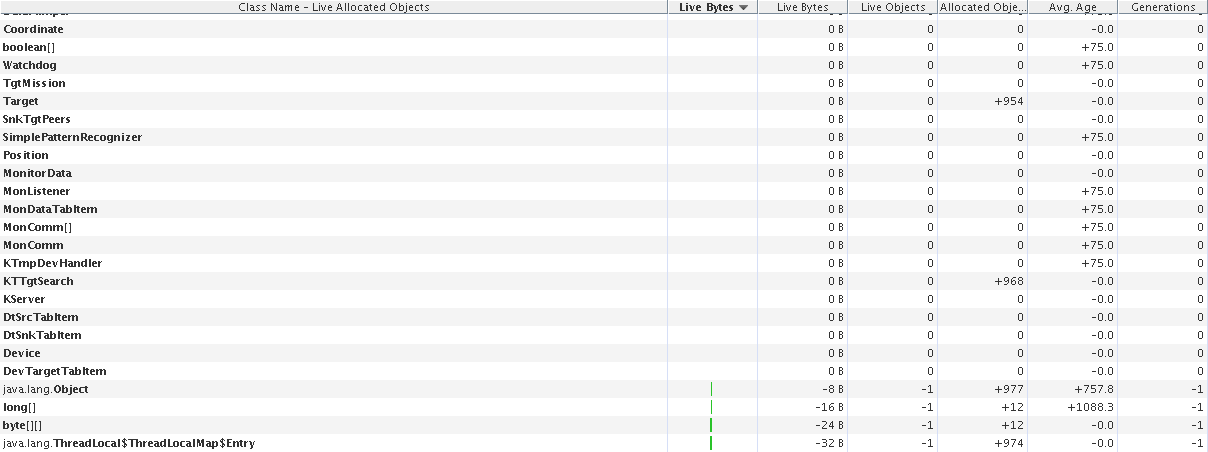
Second Image: Bottom rows of difference
http://soheil.jahangiri.googlepages.com/difference1.png
I left the program to work more, and I got snapshot from total performance of program.
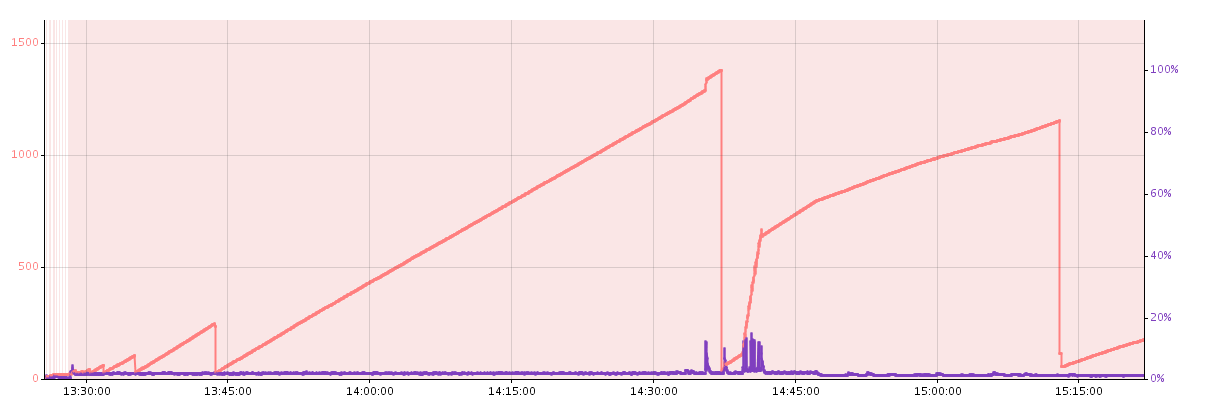
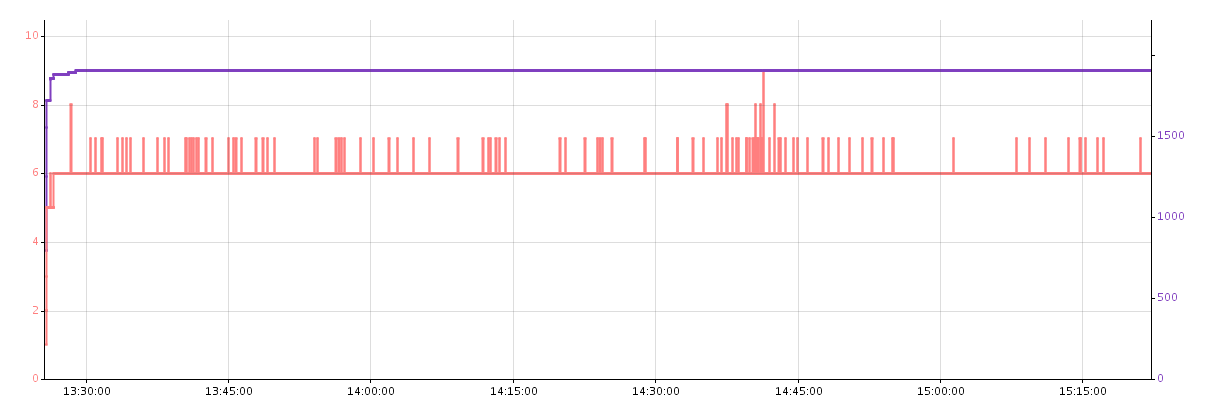
Here is the GC vs surviving generations from beginning
http://soheil.jahangiri.googlepages.com/GC.png
Here is the Threads vs loaded classes
http://soheil.jahangiri.googlepages.com/threads.png
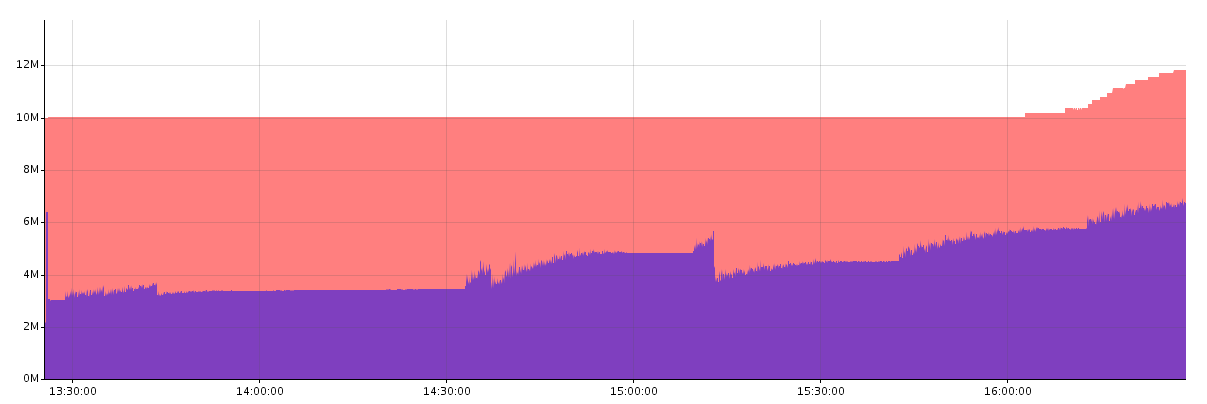
Here is snapshot of used heap.
http://soheil.jahangiri.googlepages.com/memory-heap4.png
can someone explain what happens? it seems that the garbage collector doesn't collect correctly! or maybe the resources which are being used by threads don't get free. but on the other hand I remember I read somewhere that the memory of threads are not allocated from the heap. also when I track my memory from live results in NetBeans Profiler while the used memory is getting high I see most of memory is used by byte[] and int[] instances. I investigated into the allocation stack trace of byte[], in allocation call tree I saw the instance which is using the memory the most is called from oracle.jdbc! is it possible that jdbc don't free the memory?!
I forgot to say I'm using JDK 1.5 , NetBeans 6.1 and SuSe.
I also tested with JDK 1.6, NetBeans 6.1 and Ubuntu but I got the same results.
another point is the surviving generations! surviving generations grows at a high rate! maybe it is reasonable because I'm saving some data in Vectors. but I don't see that generations in live results and what are these sharp descents? if garbage is collecting in that points why my used heap size doesn't decrease?!!! I empty my Vector slowly not suddenly!
OMG! what a mess! I'm really confused!!! :confused:
any help is appreciated :-)
