Hi guys,
I have a difficult problem to solve.
I have a list with 4 columns of values as follow

750.633 379.039 652.524 1112.63
930.491 452.16 842.753 1191.78
882.063 446.411 787.56 1183.43
434.362 410.174 325.863 1145.34
954.426 445.297 865.449 1183.74
1233.67 194.909 1155.27 908.305
1505.97 917.95 1441.07 1698.01
852.882 133.219 754.444 845.786
429.308 392.396 324.916 1127.72
358.381 310.049 241.12 1037.81

It can be from 10 to 700 raw entries and they are stored in a text file.

For the time being I will just focus on the first 2 columns (i just need to keep the other 2 as they are).

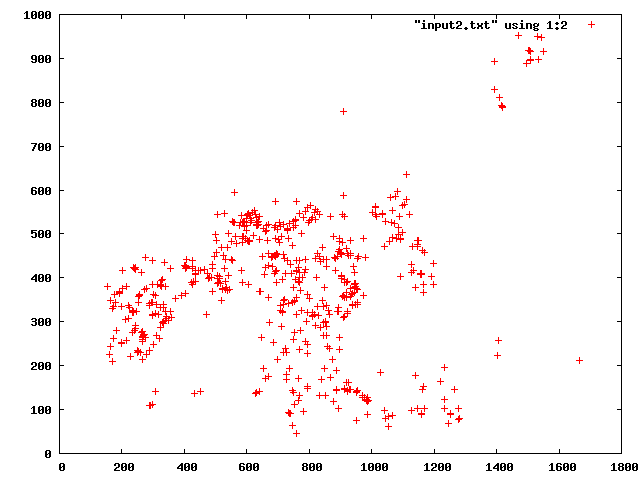
Now consider the first 2 columns as the x and y coordinates.
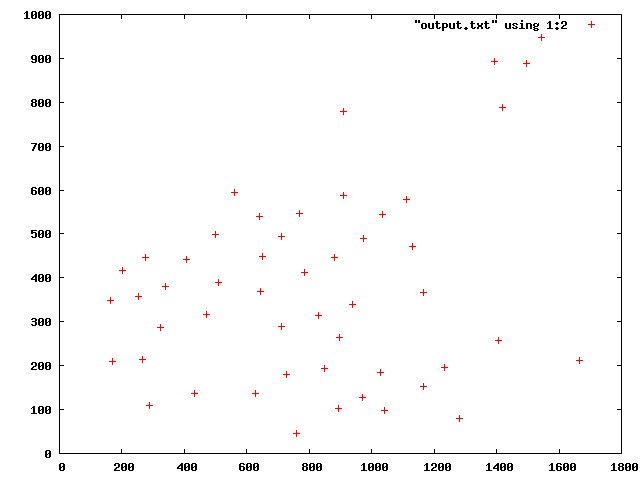
What I want to do is to select a certain amount of raws(let's say less than 100, if they are more) to be well distributed in space.
How can I do that?
Thanks a lot in advance :)
G.

Recommended Answers

All 22 Replies

The question is what do you mean by 'well distributed' ? Consider a collection of 1000 real numbers. When will you say that they are well distributed on the real line ?

If you immagine the Cartesian axes, i would like the point (x y, or first and second column in my case) to be homogeneously distributed.
To make it simple, we have 1000 values and they are
900 around the coordinate 10x-10y
90 around 40x-40y
10 in other positions

What I want is
to keep the spare 10
to take other 5 to 10 around 40x-40y
other 5 to 10 around 10x10y.

I would like the point to be equally spread in the 2d space.
Thank you

Does anybody have a solution or a possible approach to the problem?

I have an idea: suppose that you have N points and that you have already chosen k points P0, P1, ... P(k-1). For each of the remaining points, say Q, you define
f_k(Q) = min(dist(Q, Pi) for 0<= i < k)
Then you choose Pk to be the Q with the maximum f_k(Q). For other Qs, you can then compute by induction
f_(k+1)(Q) = min(f_k(Q), dist(Q, Pk))

This algorithm means that you always choose the point which minimal distance to points already chosen is maximal. You can choose the first point randomly, and the algorithm stops when the desired number of points have been chosen.

Unfortunately I'm not a math person so I'm sorry if my replay will sound stupid.
You state that I already have a k number of known point... but how can i get this?
The problem is exactly how to select point according to their distribution. If I can select some of them it's not a huge problem to find the ones which are closer to them. For instance, a kind of buffer around their xy value so that if the selected point is 430x,320y select every point with x>420 and < 440 and y>310 and <330. Isn't it?
But the problem is exactly how to find the right points to use for the filtering.

The idea is that you choose the first point randomly and the algorithm tells you how to find the second point (it's the point farthest to the first one), then the algorithm tells you how to select the third point, etc, it's an algorithm by induction.

OK, I guess I understood even if it seems to me that this will produce points only close to the edges of the xy axis (i mean, if i randomly select 0,0 the farthest one would be something like 100,100; the farthest from 100,100 would be 1,1 and so on...am i mistaken?)
Anyway, how would you translate it python code, assuming that instead of selecting a random point i will choose the first one in the list?

Well, here is not python code but pseudo-code, which you could translate to python

inf = float("infinity")

f = dict()
for x, y in read_points_from_file():
    f[(x,y)] = inf

P = list() # initial list of chosen points
P.append(f.pop())

while len(P) < K: # K = number of desired points
  for (x, y), v in f.items():
    f[(x,y)] = min(v, dist(P[-1], (x, y)))
  v, (x, y) = max((v, k) for k, v in f.items())
  P.append((x, y))
  del f[(x,y)]

Yes, because the 1,1 would be close to 0,0 and not be chosen.

OK so, there should be something wrong in my "translation" of the code that Gribouillis suggest me.
This is what I wrote

OutputPointsAG="test-filter1.txt"
TmpCopyFile="temp/xylist-copy.txt"

K=50


temp = open(TmpCopyFile)
# Create the OUTPUT file
file3=open(OutputPointsAG,'w')


inf = float("infinity")
 
f = dict()

#for x, y in read_points_from_file():

for line in temp:
	x=float(line.split('  ')[0])
	y=float(line.split('  ')[1])
	for x,y in temp:
		f[(x,y)] = inf
	P = list() # initial list of chosen points
	P.append(f.pop())
 
while len(P) < K: # K = number of desired points
  for (x, y), v in f.items():
    f[(x,y)] = min(v, dist(P[-1], (x, y)))
  v, (x, y) = max((v, k) for k, v in f.items())
  P.append((x, y))
  del f[(x,y)]

and the output is
"too many values to unpack"

What can I do now?

I change the line 21


with

for x,y in line:

and now it tells me

need more than 1 value to unpack

from too many to too little?!?
I'm a bit lost

I would change the code to

OutputPointsAG="test-filter1.txt"
TmpCopyFile="temp/xylist-copy.txt"

K=50


temp = open(TmpCopyFile)
# Create the OUTPUT file
file3=open(OutputPointsAG,'w')


inf = float("infinity")
 
f = dict()

#for x, y in read_points_from_file():

for line in temp:
        x, y = (float(z) for z in line.split()[:2])
	f[(x,y)] = inf
P = list() # initial list of chosen points
k, v = f.popitem()
P.append(k)

def dist2((a, b), (c, d)):
    return (a - c)**2 + (b - d)**2

while len(P) < K: # K = number of desired points
  for (x, y), v in f.items():
    f[(x,y)] = min(v, dist2(P[-1], (x, y)))
  v, (x, y) = max((v, k) for k, v in f.items())
  P.append((x, y))
  del f[(x,y)]

for x, y in P:
    file3.write("{0:.5E} {1:.5E}\n".format(x, y))

It would be nice if you send your datafile as an attached file, so that we can test the code.

Thanks again for your precious help.
Being honest I don't know how to put attachments here.
Below is a sample of raws in the file xylist-copy.txt
But now I get the error
.5E empty field name

1505.97  917.95  1441.07  1698.01
852.882  133.219  754.444  845.786
429.308  392.396  324.916  1127.72
358.381  310.049  241.12  1037.81
405.872  441.11  299.234  1178.31
266.93  214.043  155.965  939.892
639.104  488.327  548.933  1229.75
232.704  325.783  120.174  1057.07
1160.15  91.0852  1077.33  790.56
768.174  390.536  671.636  1125.28
221.474  336.952  109.463  1069.17
767.529  438.892  674.521  1177.39
305.969  142.051  190.181  861.082
933.128  376.406  835.931  1105.97
890.335  323.236  794.463  1051.51
718.685  520.725  633.627  1264.01
199.976  251.12  84.7291  977.972
844.146  441.789  751.62  1179.94
949.15  339.29  857.286  1069.54
520.82  373.503  414.789  1106.56
407.488  423.06  301.92  1159.82
988.701  121.626  893.29  825.706
733.456  93.4953  626.743  800.837
201.76  417.673  92.7332  1154.09
839.992  167.897  738.29  880.531
223.188  332.978  111.013  1064.67

But now I get the error
.5E empty field name

Yes I edited the previous post to solve this error.
To attach a file, edit your post with the button 'use advanced editor' at the bottom of this page, then there is an icon in the advanced editor to attach a file. Then you only need to browse to the desired file and click upload in the popup window which appears. It's better to zip the file (compressed text files are much shorter than the original version).

No errors now but the output numbers are

5.07661E+02 3.88728E+02
1.54457E+03 9.47144E+02
1.28122E+03 8.04227E+01
9.08728E+02 7.78651E+02
9.37612E+02 3.40131E+02
1.66442E+03 2.12045E+02

I attach the data file

No errors now but the output numbers are

5.07661E+02 3.88728E+02
1.54457E+03 9.47144E+02
1.28122E+03 8.04227E+01
9.08728E+02 7.78651E+02
9.37612E+02 3.40131E+02
1.66442E+03 2.12045E+02

I attach the data file

Aren't there 50 output points ? I chose to output them in the exponential notation. If you don't like it, use f instead of E in the format statement.

Oh great!! Really thank you!
If I want to keep also the other 2 values in the raw, should I have to edit line 19?

x, y = (float(z) for z in line.split()[:2])

Last question (and I will stop to profit of your kindness, I promise). Isn't there any kind of random in the script you wrote, right?
I mean, if I run the code several time I will get the same result, isn't it?
I will take some time to read (and understand) your code but it's already very easy because of your comments!
Thanks a lot,
G.

There is something random when i chose the first point with popitem(). You could replace this by choosing the first (x, y) from the first line of the file if you want something deterministic (well, I didn't consider the unlikely possibility of equal values when I select the maximum. This could also introduce some randomness).

If you want to keep the whole line, you could build a second dictionary to keep the lines

lines = dict()
f = dict()
for line in temp:
        x, y = (float(z) for z in line.split()[:2])
	f[(x,y)] = inf
        lines[(x,y)] = line

Then at the end you would print

for x, y in P:
    file3.write(lines[(x,y)])

Last thing, it would a good idea to draw scatter plots of the input and output data to see if the algorithm does something close to what you are expecting.

Ok thanks again... you rock!
About the plots, yes, I will definitely do it. Also, I wrote another script to group the points per X value (0 to 100; 101 to 200;...) just to simplify and not involving also the Y.
This will give me a general idea of the filtering operation (for example, there were 20 raws with X betwee 0 and 100 and after filtering there are 2).
It is probably useless... but it will help me to understand and make practice with python.
Thanks again!
G.

The funny thing is that this completely destroys the distribution of the data making it look uniformly distributed, when it actually is not as minimum distance between data points is maximized.

I'm sorry but I lost it

The funny thing is that this completely destroys the distribution of the data making it look uniformly distributed, when it actually is not as minimum distance between data points is maximized.

Here are scatter plots of input of output obtained with gnuplot in a linux terminal

$ gnuplot
gnuplot> set terminal png
Terminal type set to 'png'
gnuplot> set output 'figoutput.png'
gnuplot> plot "output.txt" using 1:2
gnuplot> quit

The algorithm seems to work nicely and indeed, it destroys the distribution of the data but keeps the global geometric shape of the cloud.

Be a part of the DaniWeb community

We're a friendly, industry-focused community of developers, IT pros, digital marketers, and technology enthusiasts meeting, networking, learning, and sharing knowledge.