
I'm looking for a graphic library to create a visual for data that involves between about 100 to 300
data points. Each set of data points covers a full day - so one day would have a few hundred data points total, and I'm looking to plot a graph of how the data moves during the data.
My site is in PHP but I know there are JavsScript libraries as well, which is fine. I'd like if it was possible to have output in an image format (think that can only be done in PHP?) but that's not a requisite.
I've been using the Image_Graph PHP library up to now, though my old code no longer seems to work and I don't know why.
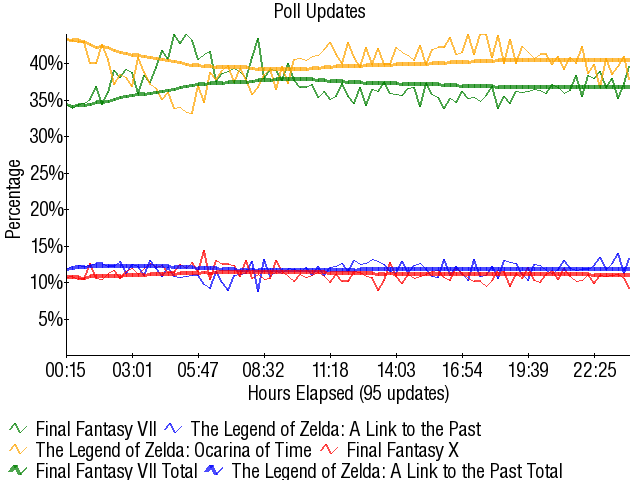
Here is an example of the types of graphs I am trying to make:
This chart tracks the total votes for an online poll with four choices, over 24 hours. It shows the votes for every 5 minute block, as well as the total votes up to that time, for all four entrants.
What are some suggestions for the best libraries for this?
