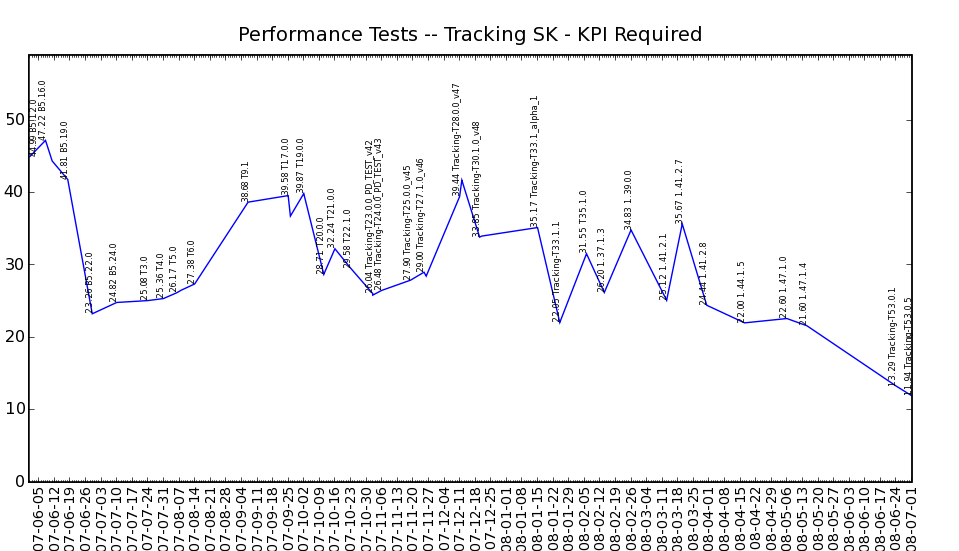
Has been working on performance graphs for a cluster of server over the last couple of week for a company with matplot lib and python. The prolem is that the picture that's been published of the graph has a couple of labels that they feel is 'hard to read' 'cause they are to close to each other. So they wanted that each new "dot" in the graph (value change) should be implemented with a html hotspot to get the values and labels when hovering the mouse over the spot. The problem is that the graph is plotten by date2num() so the "smalest" value is 732828 and so forth. To make hotspots on that image some coordinates has to be found based on the plot coordinates and so on. Is there someone that has an idea to do this or mayby already have? Attached an example of the graph

peter_budo 2,532 Code tags enforcer Team Colleague Featured Poster
Be a part of the DaniWeb community
We're a friendly, industry-focused community of developers, IT pros, digital marketers, and technology enthusiasts meeting, networking, learning, and sharing knowledge.