hey people,

i still have a problem about how to moove from a DataTable full with csv Value to a multi-line chart.
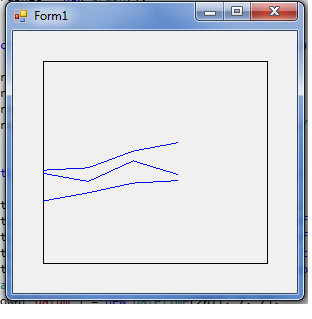
The fact is,in my DataTable,i have many value of censor(in °C,KWh,Mwh..)and i want to represent for each censor value a multi-line chart,with Date and time in X Axis,and with two Y axis the Legend and value of censor.

i joined a sample of csv to fell my DataTable

that is the part of my code

using System;
using System.Collections.Generic;
using System.ComponentModel;
using System.Data;
using System.Drawing;
using System.Text;
using System.Windows.Forms;
using System.IO;
using Microsoft.VisualBasic;
using System.Globalization;
using System.Drawing.Drawing2D;
using ZedGraph;
using System.Linq;
using System.Windows.Forms.Integration;
      public DataTable BuildDataTable(string fileFullPath, char  seperator)
        {
            
            const int EOF = -1;
            DataTable myTable = new DataTable("MyTable");
            DataRow myRow;
            StreamReader myReader = new StreamReader(fileFullPath);
            string Set_Data = myReader.ReadLine();

            int Set_len = Set_Data.Length;
            try
            {
                myReader = new StreamReader(fileFullPath);
            }
            catch (Exception ex)
            {
                MessageBox.Show("Fout bij openen bestand: " + ex.Message);
                return new DataTable("Empty");
            }
            try
            // Open file and read first line to determine how many fields there are.            
            {
                string[] fieldValues = new string[Set_len];//myReader.ReadLine().Split(new Char[] { seperator, '\t' }); 
                //skip title               
                // Title = fieldValues[2];               
                //string [] Get_val  = myReader.ReadLine().Split(new Char[] { seperator, '\t' });

                //fieldValues = myReader.ReadLine().Split(new Char[] { seperator, '\t' });
                fieldValues = myReader.ReadLine().Split(new Char[] { seperator, '\t',  });

                // Adding the first line of data to data table (columnnames)                
                // Create data columns accordingly                
                for (int i = 0; i < fieldValues.Length; i++)
                {
                    //if (i==0) myTable.Columns.Add(new DataColumn("Code"));                   

                    //if (i==1) myTable.Columns.Add(new DataColumn("Datum"));                  
                    myTable.Columns.Add(new DataColumn(fieldValues[i].ToString().Trim()));
                }
                //Now reading the rest of the data to data table               
                while (myReader.Peek() != EOF)
                {
                    fieldValues = myReader.ReadLine().Split(new Char[] { seperator, '\t' });
                   
                    myRow = myTable.NewRow();
                    for (int i = 0; i < fieldValues.Length; i++)
                    {

                        myRow[i] = fieldValues[i].ToString().Trim();


                    }
                    myTable.Rows.Add(myRow);
                }
            }
            catch (Exception ex)
            {
                MessageBox.Show("Error building datatable: " + ex.Message);
                return new DataTable("Empty");
            }
            finally
            {
                if (myReader != null)
                {
                    myReader.Close();
                }
            }
            myTable.AcceptChanges();
            if (myReader != null)
            {
                myReader.Close();
            }
            dataGridView1.DataSource = myTable;           
              return myTable;
}
 public void Proces_File() 
        {
            char[] Separator = { ';', ':' };
            String Choose_File;
            DataTable DT;
            OpenFD.InitialDirectory = "Y:\\";
            OpenFD.Filter = "txt files(*.txt)|*.txt|All Files(*.*)|*.*";
            OpenFD.FilterIndex = 2;
            OpenFD.RestoreDirectory = true;
            if (OpenFD.ShowDialog() != DialogResult.Cancel) 
            {
                Choose_File = OpenFD.FileName;
                richTextBox1.LoadFile(Choose_File, RichTextBoxStreamType.PlainText);
                DT = BuildDataTable(OpenFD.FileName, ';');
                this.dataGridView1.DataSource = DT;
            
            
            }
  private void button3_Click(object sender, EventArgs e)
        {

            Proces_File();

        }

thx in advance

Recommended Answers

All 10 Replies

Hi rminator, me again.
Did I not gave you this link? http://www.drxudotnet.com/csharp_2dchart.html
It contains code to draw two functions(sine and cosine) in the same graph. Something you want. If you consider a column of a DataTable with numeric values, this is just the same as some sort of math function. What part of that code in the link you don't understand? And I don't mean line 31 of your code;)

Hey ddanbe,

i saw this link,but the way to get the value inside my DataTable,and build Point with it is all my Problem,i try with ArrayList,but it not run,take the value of each Rows and build Point can for my Chart,may be you can help me.

Thx in advance

Because, if I remember well, the first column of your datatable is a DateTime and you want to plot a value against a Datetime, the X component of your Point structure is easy: it is just an index. Will be back this evening.

So far I have this I made a Graph class, for the moment it just draws a rectangle.
See if you can understand it all.

using System;
using System.Collections.Generic;
using System.Linq;
using System.Text;
using System.Drawing;

namespace GraphApp
{
    class Graph
    {
        // Define the drawing area
        private Rectangle PlotArea;

        public Graph()
        { 
            // Set default values
            xMin = -10f;
            xMax = 10f;
            yMin = -10f;
            yMax = 10f;
            nPoints = 20;
            borderoffset = 30;
        }

        public Rectangle ChartArea { get; set; }

        // Units defined in world coordinate system :
        public float xMin { get; set; }
        public float xMax { get; set; }
        public float yMin { get; set; }
        public float yMax { get; set; }

        public int nPoints { get; set; }

        // Unit in pixel:
        // used to be: private int offset = 30;
        public int borderoffset { get; set; }

        public void DoDraw(Graphics G, Rectangle ChartArea)
        {
            // Calculate the location and size of the plot area
            // within which we want to draw the graphics:

            PlotArea = new Rectangle(ChartArea.Location, ChartArea.Size);
            // Adjust Plotarea for border
            PlotArea.Inflate(-borderoffset, -borderoffset);
            //Draw PlotArea:
            G.DrawRectangle(Pens.Black, PlotArea);

        }

        // Transform a point with real world values to a point on the screen.
        // Did something similar in a code snippet I gave you 
        private PointF Point2D(PointF ptf)
        {
            PointF aPoint = new PointF();

            if (ptf.X < xMin || ptf.X > xMax ||  ptf.Y < yMin || ptf.Y > yMax)
            {
                ptf.X = Single.NaN;
                ptf.Y = Single.NaN;
            }
            aPoint.X = PlotArea.X + (ptf.X - xMin) *  PlotArea.Width / (xMax - xMin);
            aPoint.Y = PlotArea.Bottom - (ptf.Y - yMin) * PlotArea.Height / (yMax - yMin);
            return aPoint;
        }
    }
}

And here is the code in my Form class to make it work

namespace GraphApp
{
    public partial class Form1 : Form
    {
        private Graph Graphic;

        public Form1()
        {
            InitializeComponent();
            Graphic = new Graph();
        }

        protected override void OnPaint(PaintEventArgs e)
        {
            Graphic.DoDraw(e.Graphics, ClientRectangle);// ClientRectangle = form
        }
    }
}

Hope this helps you a bit on the way, see ya

Thx ddanbe,
i saw it,and i can understand it too,but now my question is how can i make to build aPoint.Y and aPoint.X,i mean how can i extract those Value for my DataTable????

Thx a lot

Working on it :)
It may perhaps surpise you but I am not a pro!
This is as much learning for me than it is for you.
Let you know soon some more.

Allright and Thx

hier is a part of my code where i take the values(contain) in a DataTable in a List and try to Build Point for my Chart,but when i try to run my application,it not run and visual studio stop to work, may be somebody can help me.

thx

public void ADD_Chart_Style( ZedGraphControl ZGC, DataTable My_DT)
        {
            Graphics G= this.CreateGraphics() ;
            DataRow Dat_Row;
            DataColumn Dat_Colm;
            int Index = 0;
 
            //Save the value in our DataTable in a List
            List<DateTime> XDate = new List<DateTime>();
            List<double> Value = new List<double>();
            List<DataRow> My_Ro_List = new List<DataRow>();
            foreach (DataRow My_DT_Rows in My_DT.Rows)
            {
                My_Ro_List.Add(My_DT_Rows);
                foreach (var item in My_DT_Rows.ItemArray)
 
                    Value.Add(Convert.ToDouble(item));
 
            }
            String Temp = "Date";
            var Result = My_DT.AsEnumerable();
            foreach (var result in My_DT.Columns)
            {
                XDate.Add(Convert.ToDateTime(My_DT.Columns.IndexOf("Date")));
            }
 
            List<DataColumn> My_C_List = new List<DataColumn>();
 
            foreach (DataColumn MY_DT_COL in My_DT.Columns)
            {
 
                My_C_List.Add(MY_DT_COL);
 
            }
            //Draw Chart Area and PlotArea

            // make upe some Data Array BAsed on the sin function
            int len = My_DT.Columns.IndexOf("Date");
           
            DateTime[] X_ValData = new DateTime[len];
            PointPairList List1 = new PointPairList();
            for (int i = 0; i < My_DT.Rows.Count; i++)
            {
                
                List1.Add(Convert.ToDouble(XDate[i]), Convert.ToDouble(Value));
                X_ValData[i] = XDate[i];
 
                for (int j = 0; j < My_DT.Columns.Count; j++)
                {
                    //clear out  old Items
                    ZGC.MasterPane.PaneList.Clear();
                    GraphPane My_pane = new GraphPane();
                    My_pane.CurveList.Clear();
                    My_pane.GraphObjList.Clear();
                    // Set the Control GraphPane to my Pane
                    ZGC.GraphPane = My_pane;
                    // Get a new line Item and set it up

                    My_pane.Title.Text = "Auswerte Software Version 1.0";
                    My_pane.Title.FontSpec.Size = 14;
                    My_pane.XAxis.Title.Text = "DATE/Hour/Minutes";
                    My_pane.YAxis.Title.Text = "Value";
                    My_pane.Fill = new Fill(Color.White, Color.FromArgb(220,220,255),45F);
                    LineItem My_Curve = new LineItem("" , List1 , Color.DarkBlue , SymbolType.Diamond);
                    //My_Curve[j] = My_pane.AddCurve("", List1, Color.DarkBlue, SymbolType.Diamond);
                    My_Curve.Symbol.Size = 6;
                    My_Curve.Symbol.Fill.Color = Color.DarkBlue;
                    My_Curve.Symbol.Fill.IsVisible = true;
                    My_Curve.Line.IsVisible = false;
 
                    //Set the GraphicPhane Up Wit Tittle etc
                   
                    //Add the new Line Items to the GraphPane
                     
                     My_pane.CurveList.Add(My_Curve);
                    // Get the Axis to Update
                    My_pane.AxisChange();
                }
                using (Graphics g = this.CreateGraphics())
                {
                    ZGC.MasterPane.ReSize(g, ZGC.MasterPane.Rect);
                }
                ZGC.Invalidate();

and this in my Form

ZedGraphControl My_ZGC = new ZedGraphControl();
        private void Form1_Load(object sender, EventArgs e)
        {
         
            string Use_Path = OpenFD.FileName;
            //Graphics Obj = this.CreateGraphics();
            
            DataTable MY_D = new DataTable();
            MY_D = BuildDataTable( Use_Path, ';');
 
            Cs.ADD_Chart_Style( My_ZGC, MY_D);
 
        }
        public void Set_SiZe() 
        {
            My_ZGC.Location = new Point(10,10);
            My_ZGC.Size  = new Size(this.ClientRectangle.Width - 20,this.ClientRectangle.Height - 20);
 
        
        }
        public void Graph_load() 
        {
            Form new_F = new Form();
            new_F.Controls.Add(My_ZGC);
            new_F.ShowDialog();
        
        }

hey, i am still looking for the way my code never run,can somebody have the solution of my problem???

Hi, rminator, long time no see I guess :)
If you want to continue with ZedGraph, very OK, but ask ZedGraph if you have problems.
Anyway I progressed a little with my "graph" project(you do not want to know what a man has got to do, once he's retired!!!)
I've included a zip of my project and picture of how it looks.
To add titles, legend and other graph stuff should not be that difficult.
Questions? Just ask. Success.

Be a part of the DaniWeb community

We're a friendly, industry-focused community of developers, IT pros, digital marketers, and technology enthusiasts meeting, networking, learning, and sharing knowledge.