Hi folks.

The short question:
(A) Can I set the colour on each individual item/element/point/column in a chart with column series? Or even have gradient on it?
(B) I want to put names on each column, visible under the X-axix. Now they are simply numbered.

(C) data source? (see below)

The longer explanation why I ask:

(A)

Im trying to make a nice chart for my eight batteries that i'm supervising via the serial port.
Normally, the elments of one series in the chart always have the same colour. But I want the column to change colour if the voltage is too high or too low. In this case, I have solved it by making three series of data, with three different colours, and using different series for the data depending on which colour I want it to be displayed with. That works fine. I set the data points to zero for the colours that shall not be used, and are using the StackColumn feature to put the columns of the different series on the same place.

This is sheating! I actually does not set different colours of the elements in the same series, but the problem is solved by using many series.

That's all good, but I want more!

I actually want each column to have a unique colour dependent on it's value (compared to the mean value of all columns). This chart shall be able to display up to 96 columns - that's a lot! And I really don´t want the chart to contain 96 series of data containing 96 points each!
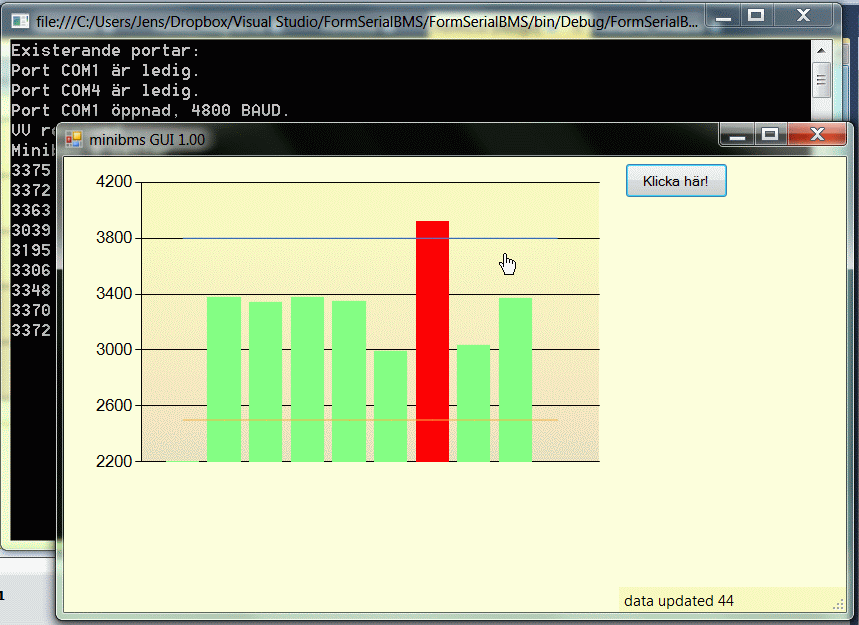
chart1b

(B and C)

I tried to add data through "data binding" or adding a "data source" to the chart. ut I couldn't figure out how to create the object containing the data.

The simplest form of data is just an array of integers. A more sophisticated source of data could, for example, contain also names of each data point.

After failing adding a "data source" I added data in my own way. I got an integer array with eight elements. I just add them one by one to the data series by the line:

chart1.Series["name_of_series"].Points.Add(value);

Is there a simple way to add labels to each column like I add the data values?
Or is there a simple way to add data in a more sophisticated way, using an object where names (labels) and values are embedded?
Recommended Answers

All 5 Replies

The short answer to most of your questions is: Yes it can be done.

I prefer to use a DataTable for the data source. Here is an example of how to set the needed properties to produce my interpretation of what you are looking to accomplish. If you have any questions, please do not hesitate to ask them.

using System;
using System.Data;
using System.Drawing;
using System.Windows.Forms;
using System.Windows.Forms.DataVisualization.Charting;

namespace Example_Battery_Chart_Csharp
{
    public partial class Form1 : Form
    {

        public BatteryTable Batteries = new BatteryTable(8);
        private System.Windows.Forms.DataVisualization.Charting.Chart bc = new System.Windows.Forms.DataVisualization.Charting.Chart();

        public Form1()
        {
            InitializeComponent();
        }

        private void Form1_Load(object sender, EventArgs e)
        {
            bc.DataSource = Batteries;
            bc.Legends.Clear();

            bc.ChartAreas.Clear();
            bc.ChartAreas.Add("Primary");
            bc.ChartAreas["Primary"].AxisY.Minimum = 0;
            bc.ChartAreas["Primary"].AxisY.Maximum = 100;
            bc.ChartAreas["Primary"].AxisY.Interval = 25;
            bc.ChartAreas["Primary"].AxisY.MajorGrid.Enabled = true;
            bc.ChartAreas["Primary"].AxisY.MajorGrid.Interval = bc.ChartAreas["Primary"].AxisY.Interval;
            bc.ChartAreas["Primary"].AxisY.MinorGrid.Enabled = true;
            bc.ChartAreas["Primary"].AxisY.MinorGrid.Interval = 5;
            bc.ChartAreas["Primary"].AxisY.MinorTickMark.Enabled = true;
            bc.ChartAreas["Primary"].AxisY.MinorTickMark.Interval = 5;
            bc.ChartAreas["Primary"].AxisY.MinorTickMark.TickMarkStyle = TickMarkStyle.AcrossAxis;


            bc.Series.Clear();
            bc.Series.Add("Level");

            bc.Series["Level"].ChartArea = "Primary";
            bc.Series["Level"].ChartType = SeriesChartType.Column;
            bc.Series["Level"].CustomProperties = "DrawingStyle=Cylinder";
            bc.Series["Level"].XValueType = ChartValueType.String;
            bc.Series["Level"].XValueMember = "Name";
            bc.Series["Level"].YValueType = ChartValueType.Int32;
            bc.Series["Level"].YValueMembers = "Level";

            // The next 3 values can be set at the Point level as well
            // Defined here, they become the default values for the Points
            bc.Series["Level"].BackSecondaryColor = Color.White;
            bc.Series["Level"].BackGradientStyle = GradientStyle.TopBottom;
            bc.Series["Level"].Color = Color.BlueViolet;


            bc.Dock = DockStyle.Fill;
            bc.Parent = this;

            // The Customize Event is raised before the chart is drawn
            // At this point the Chart control has created all the labels
            // and points for you.  This gives you the chance to makes any 
            // changes you want.

            bc.Customize += bc_Customize;

            // This is to show you a way to update the values in the datatable
            Batteries.UpDatePoint(5, 100);

        }

        private void bc_Customize(object sender, System.EventArgs e)
        {
            Int32 mean = Convert.ToInt32(Batteries.Compute("Avg([Level])", "True"));
            for (Int32 i = 0; i < bc.Series["Level"].Points.Count; i++)
            {
                if (bc.Series["Level"].Points[i].YValues[0] < mean)
                {
                    bc.Series["Level"].Points[i].Color = Color.Red;
                }
            }
        }

    }

    public class BatteryTable : DataTable
    {
        public BatteryTable(Int32 NumberOfBatteries)
        {
            Columns.Add("ID", typeof(Int32));
            Columns.Add("Name", typeof(string));
            Columns.Add("Level", typeof(Int32));
            PrimaryKey = new DataColumn[] { Columns["ID"] };

            System.Random rand = new System.Random();

            DataRow r = null;
            for (Int32 i = 1; i <= NumberOfBatteries; i++)
            {
                r = NewRow();
                r["ID"] = i;
                r["Name"] = "B" + i.ToString();
                // For this example make some random data
                // 
                r["Level"] = rand.Next(0, 100);
                Rows.Add(r);
            }
        }

        public void UpDatePoint(Int32 ID, Int32 level)
        {
            DataRow row = Rows.Find(ID);
            if (row != null)
            {
                row["Level"] = level;
            }
        }
    }
}

Thank you!

That was what I needed to learn more how to make usable classes for my data! I will definitely take up this!

Is DataTable a fast and memory-saving type, or is it "heavy"? I will run most of the applications on an ordinary PC, and in this case, with very few elements in the table it doesn't matter, but how do programmers think about issues like speed and memory? Just use the most convenient classes? (Like I've heard, sometimes the string class is not very effective - better to use stringBuilder sometimes)

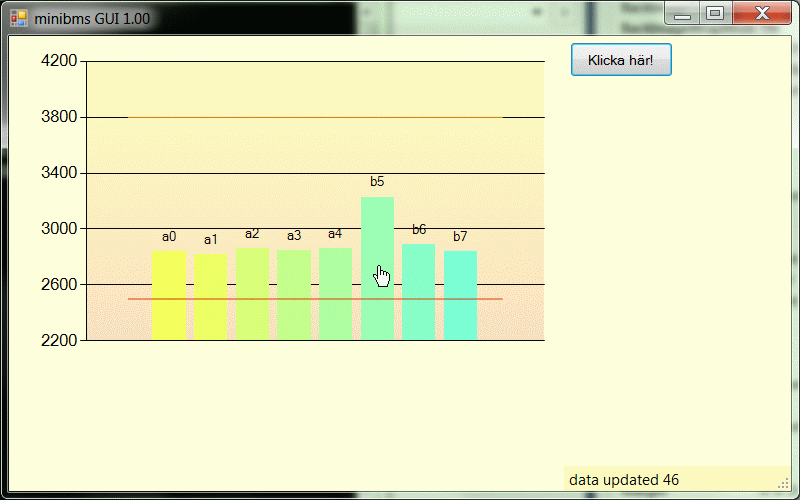
I actually solved the color and label problem at the same time when I discovered the DataPoint class. So my way of doing it was not so sofisticated as yours, but it worked!

DataPoint p = new DataPoint(chart1.Series["Celler"]);
p.SetValueY(cellVoltage[cell]); 
p.Label = cellname[cell]; // string
p.Color = Color.FromArgb(255 - cell * 20, 255, 80 + cell*20);
chart1.Series["Celler"].Points.Add(p);

As you see, I still store the data in an ordinary int array. :/

chart1_pointcolors

The DataTable class is definitely not light-weight. But it is easy to configure and I use it a lot for database manipulation. Hence I grabbed what I knew worked and presented it as solution for setting a datasource.

However, for your application, it is not the best choice.

I have done a little research and you can bind to an array, however this "Binding" is a one time event that creates the DataPointCollection. Are far as I can discern, after this intialization, there is no link back to the source data. :(

I still want to create a class that implements the INotifyPropertyChange interface and see that would work.

Since your application will be updating the Y-Values, it is probably best to create the datapoints your self once, and then update their values. This does work.

I want to put names on each column, visible under the X-axix. Now they are simply numbered.

You are currently using the "Label" property; this is typically used to show the value. To place the column label on the X-Axis, use the DataPoint.AxisLable property.

We all need something.
First:
Read the rules before posting.
Second:
Post in a new thread, where you can refer to this old thread.
Show some evidence what you have done and we will be most happy to try to help you out with all your problems and questions about what you have tried. :)

Be a part of the DaniWeb community

We're a friendly, industry-focused community of developers, IT pros, digital marketers, and technology enthusiasts meeting, networking, learning, and sharing knowledge.