Hi,

I have created a Form C# application that has alot of code inside. Runs on QuadCore processor.

The problem consumes about 2-5% CPU in general when looking in TaskManager.

Problem:
At some point the application consumes about 60-70% and stucks there forever. So I am very sure that
somewhere it gets stuck in an infinite loop.

Question:
It is almost impossible to know where in all this code, this is happening. I do run the application in debug mode
when developing.

How is it possible to detect where in an application CPU is very consuming like in this scenario, to find the
piece of code that has the problem?

Dani AI

Generated

This thread already has the right instincts (quick break-into-debugger, add logging, try a profiler). The fastest reliable answer for a noisy, multithreaded .NET app is: collect stack samples or a memory dump while the CPU is high, then inspect the stacks to see which methods and threads dominate. That avoids trying to guess which of the hundreds of places is spinning.

A practical, low-friction triage flow:

  • Use Process Explorer (Sysinternals): open the target process, Properties -> Threads, sort by CPU, select the hot thread and click Stack. The top frames usually point directly at the hot loop or call path.

  • If attaching is not possible, capture a dump on high CPU with ProcDump. Example command to capture full dumps when CPU > 60%:

    procdump -ma -c 60 -n 3 MyApp.exe

    Open those dumps in Visual Studio or WinDbg + SOS to examine managed stacks and GC/heap state. Capture several dumps spaced over a few seconds to see consistent hot stacks.

For a deeper, aggregated view use a sampling profiler (ETW-based PerfView or any low-overhead sampler). Collect CPU stacks while the spike is happening and inspect TopDown/CallTree views to find the inclusive time hotspots. Sampling is preferred first because it has minimal perturbation compared with instrumentation profilers.

Things those traces typically reveal: tight busy-wait loops, accidental spin-waits, Timer/Callback flooding, long-running synchronous work on thread-pool threads, or a frequently re-entered short function (high call rate). Once the hot methods are identified, inspect for busy-wait patterns and replace them with blocking waits (events, waits, await/Task-based delays), reduce allocations if GC is hot, or move long CPU work off shared thread-pool threads. If Visual Studio Express lacks profiling features, the external tools above provide a solid path to the offending functions.

Recommended Answers

All 7 Replies

Run in debug mode and monitor CPU usage. When it jumps up, use the debug menu to 'break' the code and see where it is.

Okay, I am not sure how to do that. In the debug menu, then only break option I can see is "Toggle Breakpoint" but that just highlight a row in code?

Also, as this application is highly multithreaded, there are a lot of processes going on at the same time.
So I wonder how "break" in code can be "intelligent" to actually find the code that consumes like in this case probably 90-95% CPU of the whole application?

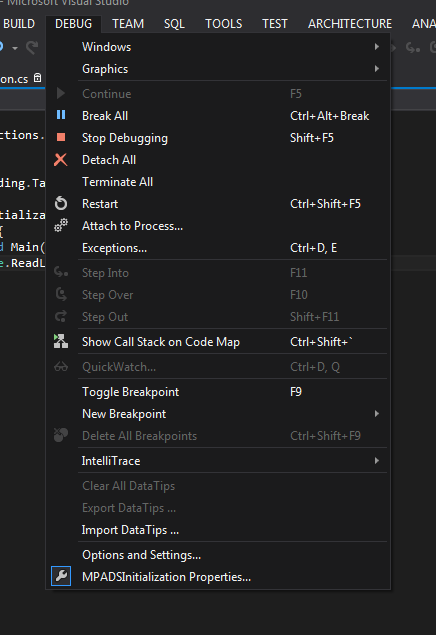
Debug menu should look like this while running, you'll want the 5th option. And VS handles multi-threading (which might be your problem, people don't understand threading very well and often misuse it).

My debug menu doesn´t look like that exactly. The 5:th options in your menu is "Stop Debugging", did you meen "Break All" ?

I run Microsoft Visual C# 2010 Express

My menu look like this:

Yes, I mean "Break All", not sure what was going on in my head then :)

Hmm, not sure VS 2010 Express has the threaded debugger. You might want to include some logging in your code and see what comes up often.

I don't know, but there should be profilers like valgrind or Quantify (IBM) for .NET applications. Have you tried any of those?

Yes I have some logging in the code but but it is quite difficult to know where to put it because it could be 100:s of places.

A Profiler sounds like a good idéa. I have never used one before but I have downloaded this one:

It can profile the CPU usage and show hotspots. I will give it a try and hope the application reproduce the problem. Stack trace/threads are possible to see on high CPU usage.

Be a part of the DaniWeb community

We're a friendly, industry-focused community of developers, IT pros, digital marketers, and technology enthusiasts meeting, networking, learning, and sharing knowledge.