I m having a problem in showing chart with datatable.

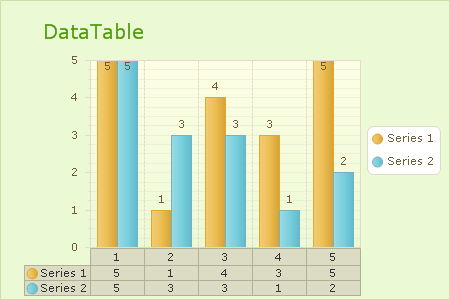
I want to show my chart as shown in below image.

Recommended Answers

All 10 Replies

Thanx Adatapost.
But i didnt find my answer there.

I think you forget to ask a question. ;) I don't know how your chart looks.

Adatapost I visited that link.
But there is details of how to bind chart with dataset and datatable.
I want to show my chart with datatable in it.
This chart control makes the image of chart and shows on webpage.
I want to include my datatable in chart's image and show it on webpage

MARKAND911, did you ever get an answer to this ? I am trying to do the same thing.

--Brian

Yes Brian i got the answer of it.

PM sent.

HI,

In our project also same requirement is there.so can you share me links / inputs/ sugesstions to me.

Thanks
Srinivas

Hi Srinivas

I have made my own control to overcome this issue.
So i am sending you a link from where you can download a demo application.

download ChartGridDemo.rar from below link
Click here

thank you
Markand

Hi MARKAND,

Thanks for the reply.

But i want to display Column Chart and datatable as exactly below X axis not separate.

Please see the attachment of column chart with datatable for the requirement.

can you please suggest some inputs as soon as possible.

Thanks
Srinivas

Be a part of the DaniWeb community

We're a friendly, industry-focused community of developers, IT pros, digital marketers, and technology enthusiasts meeting, networking, learning, and sharing knowledge.