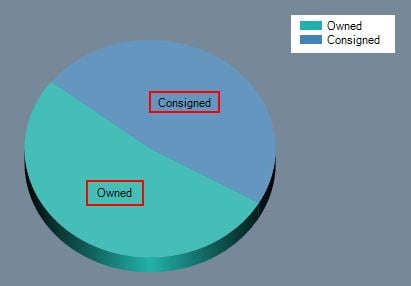
I have a databound chart in ASP.NET C#. One of the databound fields is text and the other is a value. I would like the legend to display the text for the pie chart, and I would like the value to determine how the chart is formed, and also display as a label on each piece of the pie chart.
Here is the code I have so far:
<asp:Chart ID="consignedChart" runat="server" DataSourceID="SqlDataSource4"
                        BackColor="LightSlateGray" Palette="None"
                        PaletteCustomColors="LightSeaGreen; SteelBlue" Width="400px" >
                        <Series>
                            <asp:Series Name="Series1" ChartType="Pie" XValueMember="Owner"
                                YValueMembers="TotalValue" Legend="Legend1"  >
                            </asp:Series>
                        </Series>
                        <ChartAreas>
                     <asp:ChartArea Name="ChartArea1" Area3DStyle-Enable3D="true" BackColor="LightSlateGray">
                                <Area3DStyle Enable3D="True" LightStyle="Realistic"/>
                            </asp:ChartArea>
                        </ChartAreas>
                        <Legends>
                            <asp:Legend Name="Legend1">
                            </asp:Legend>
                        </Legends>
           </asp:Chart>
Attached is an image, it might make it easier to understand. The labels in the red boxes are the ones I want changed to display the value number.