In a previous article, I explained how to extract tabular data from PDF image documents using Multimodal Google Gemini Pro. However, there are a couple of disadvantages with Google Gemini Pro. First, Google Gemini Pro is not free, and second, it needs complex prompt engineering to retrieve table, columns, and row pixel coordinates.
To solve the problems above, in this article, you will see how to extract tables from PDF image documents using Microsoft's Table Transformer from the Hugging Face library. You will see how to detect tables, rows, and columns within a table, extract cell values from tables using an OCR, and save the table as CSV. So, let's begin without ado.
Installing and Importing Required Libraries
The first step is to install various libraries you will need to run scripts in this article.
!pip install transformers
!sudo apt install tesseract-ocr
!pip install pytesseract
!pip install easyocr
!sudo apt-get install -y poppler-utils
!pip install pdf2image
!wget "https://fonts.google.com/download?family=Roboto" -O roboto.zip
!unzip roboto.zip -d ./roboto
The following script imports the required libraries into your application.
from transformers import AutoImageProcessor, TableTransformerForObjectDetection
import torch
from PIL import Image, ImageDraw, ImageFont
import matplotlib.pyplot as plt
import csv
import numpy as np
import pandas as pd
from pdf2image import convert_from_path
from tqdm.auto import tqdm
import pytesseract
import easyocr
Table Detection with Table Transformer
The Table Transformer has two sub-models: table-transformer-detection, and table-structure-recognition-v1.1-all model. As a first step, we will detect tables within a PDF document using the table-transformer-detection model.
Importing and Converting PDF to Image
The following script defines the pdf_to_img() function that converts PDF documents to bytes images. This step is mandatory since the Table transformer expects documents in image format.
# convert PDF to Image
def pdf_to_img(image_path):

  image = convert_from_path(pdf_path)[0].convert("RGB")
  return image

pdf_path = '/content/sample_input_ieee-10.pdf'
image = pdf_to_img(pdf_path)
image
Output:
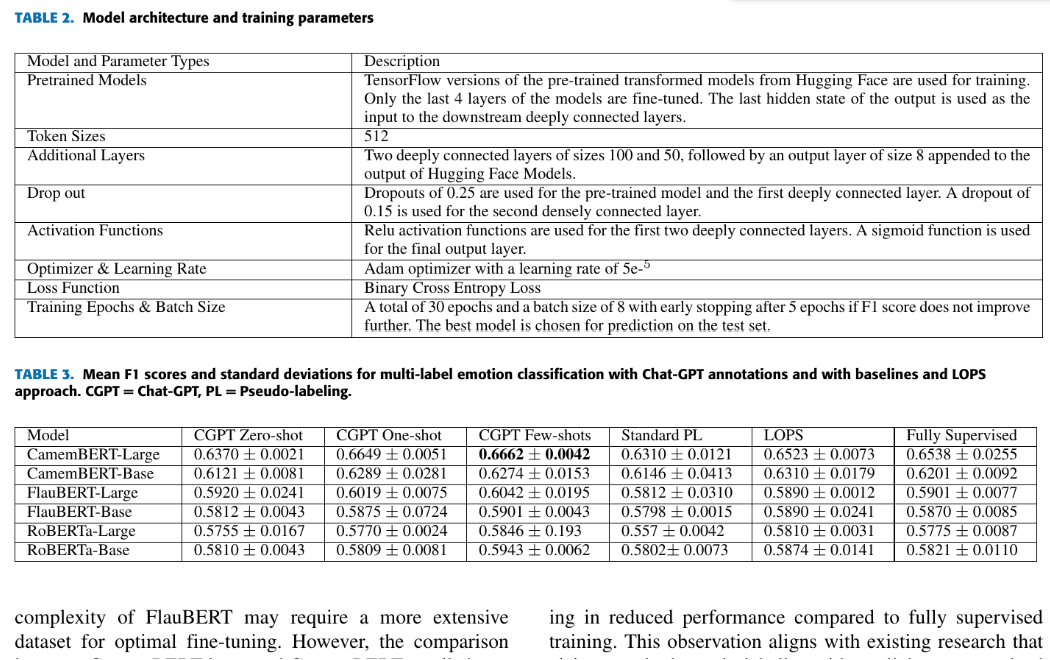
The above output shows the input image. We will detect tables inside this image.
Detecting Tables
The following script imports the preprocessor and model objects for the table-transformer-detection model. The preprocessor converts the input image to a format the table-transformer-detection model can process.
model_name = "microsoft/table-transformer-detection"
# define image preprocessor for table transformer
image_processor = AutoImageProcessor.from_pretrained(model_name)

# import table transformer model for table detection
model = TableTransformerForObjectDetection.from_pretrained(model_name,
                                                           revision="no_timm")
Next, we define the detect_table() function that accepts the input image as a parameter. The method preprocesses the image and then passes it to the table-transformer-detection model.
The preprocesses objects post_process_object_detection() method processes the output from the table-transformer-detection model. The final processed output consists of the label, bounding box coordinates, and the prediction confidence score for the detected tables. The detect_table() function returns the final output.
def detect_table(image_doc):

  # preproces image document
  inputs = image_processor(images = image_doc, return_tensors="pt")

  # detect tables
  outputs = model(**inputs)

  # convert outputs (bounding boxes and class logits) to Pascal VOC format (xmin, ymin, xmax, ymax)
  target_sizes = torch.tensor([image_doc.size[::-1]])
  results = image_processor.post_process_object_detection(outputs,
                                                          threshold=0.9,
                                                          target_sizes=target_sizes)[0]

  return results


results = detect_table(image)
results
Output:
{'scores': tensor([0.9993, 0.9996], grad_fn=<IndexBackward0>),
 'labels': tensor([0, 0]),
 'boxes': tensor([[ 111.4175,  232.4397, 1481.5710,  606.8784],
         [ 110.4231,  738.1602, 1471.6283,  916.2267]],
        grad_fn=<IndexBackward0>)}
The above output shows the confidence score, labels (0 for table), and bounding box coordinates for the two detected tables.
Next, we define the get_table_bbox() function, which prints the labels, confidence scores, and bounding box coordinates for the detected tables. The function also returns the detected bounding box coordinates for all the tables.
def get_table_bbox(results):

  tables_coordinates = []

  # iterate through all the detected table data
  for score, label, box in zip(results["scores"], results["labels"], results["boxes"]):
    box = [round(i, 2) for i in box.tolist()]

    # store bbox coodinates in Pascal VOC format for later use
    table_dict = {"xmin" : box[0],
                  "ymin" : box[1],
                  "xmax" : box[2],
                  "ymax" : box[3]}

    tables_coordinates.append(table_dict)

    # print prediction label, prediction confidence score, and bbox values
    print(
        f"Detected {model.config.id2label[label.item()]} with confidence "
        f"{round(score.item(), 3)} at location {box}"
        )

  return tables_coordinates

table_bbox = get_table_bbox(results)
Output:
Detected table with confidence 0.999 at location [69.43, 344.96, 660.61, 488.47]
Detected table with confidence 0.989 at location [68.7, 549.5, 657.53, 838.82]
Display Tables
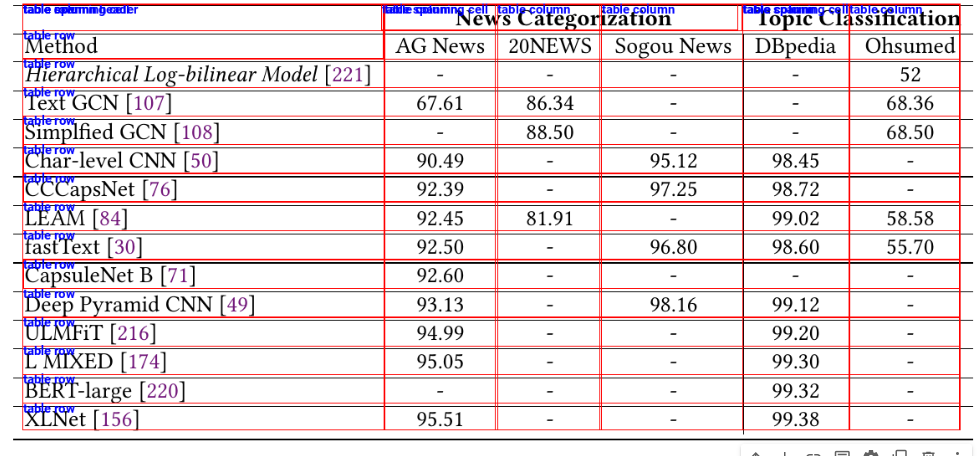
Finally, the script below plots the original image and draws red rectangles around the detected tables using their bounding box coordinates.
def highlight_tables(image, table_bbox, padding):
    # Create a drawing context for doc image
    doc_image = image.copy()
    draw = ImageDraw.Draw(doc_image)

    # Iterate over each table in the list
    for table in table_bbox:
        # Define the coordinates for the rectangle with padding for each table
        rectangle_coords = (table["xmin"] - padding,
                            table["ymin"] - padding,
                            table["xmax"] + padding,
                            table["ymax"] + padding)

        # Draw a red rectangle around the detected table
        draw.rectangle(rectangle_coords, outline="red", width=2)

    return doc_image

padding = 10
table_detected_image = highlight_tables(image, table_bbox, padding)
table_detected_image
Output:
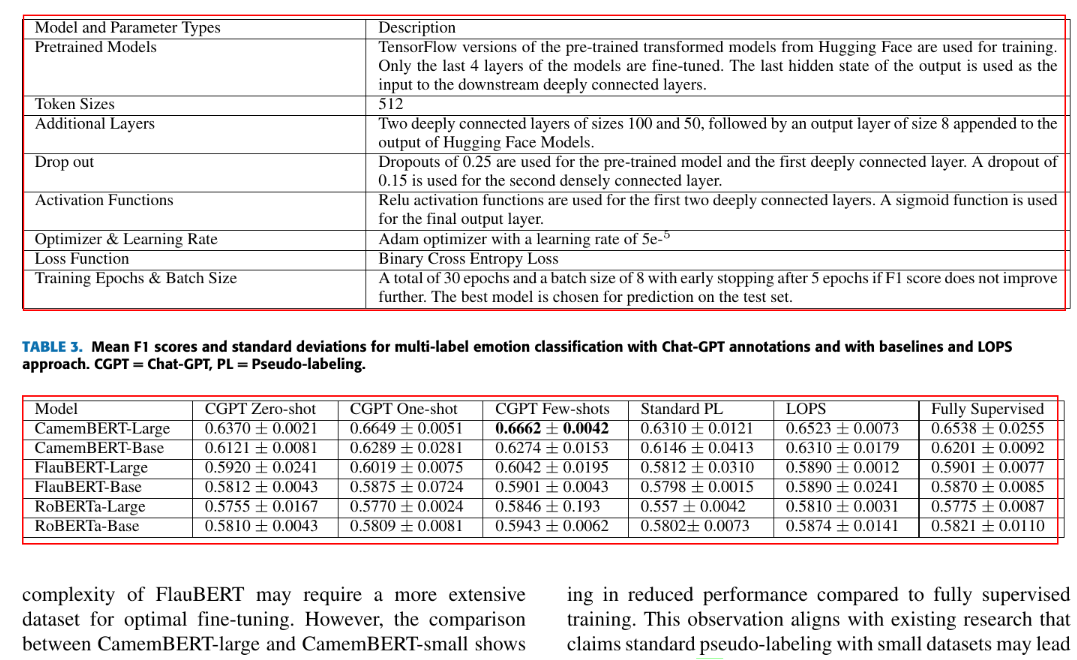
You can see the detected tables in the above image.
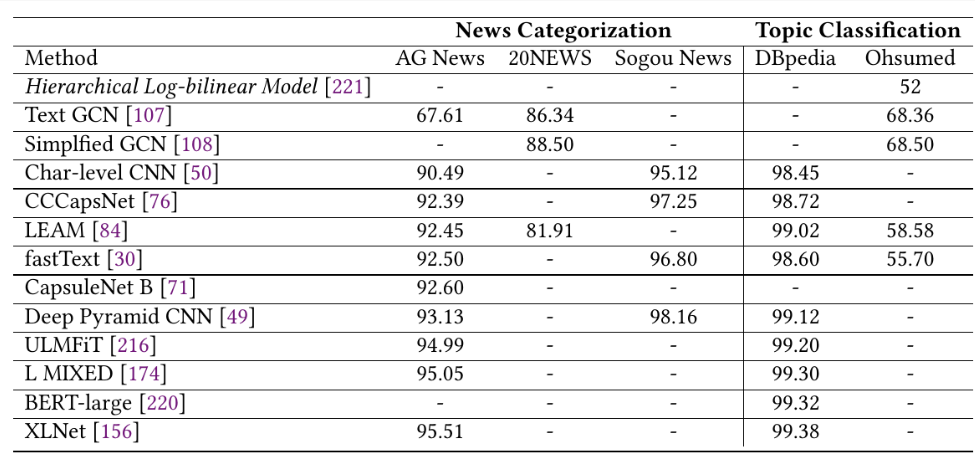
Subsequently, we define the get_cropped_image() function that accepts the original image, the corresponding bounding box coordinates, and padding values as parameters. The get_cropped_image() function returns the cropped table, which you can use to extract rows and columns.
def get_cropped_image(image, table, padding):
  # Create a new image object with the cropped area
  cropped_image = image.copy().crop((table["xmin"] -padding,
                             table["ymin"] - padding,
                             table["xmax"] + padding,
                             table["ymax"] + padding
                             ))

  return cropped_image

cropped_image = get_cropped_image(image, table_bbox[1], padding)
cropped_image
Output:
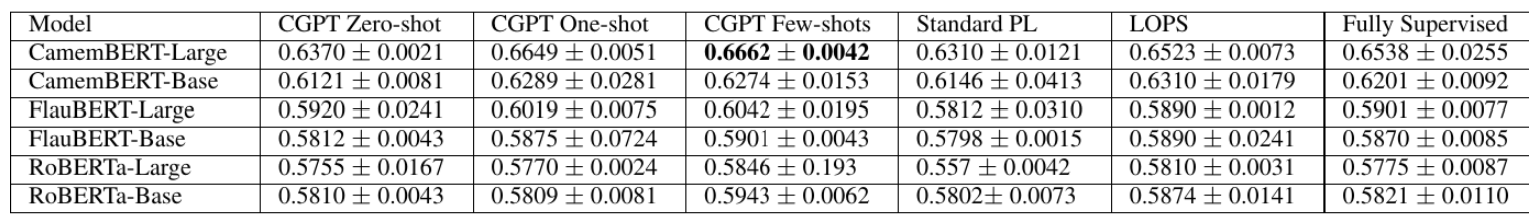
Extract Table data
Now that we have cropped a table, we can extract rows and columns.
Extract Table Features
You can extract table rows and columns using the table-structure-recognition-v1.1-all model. The following script imports this model.
# import model for detecting table features e.g. rows, columns, etc
structure_model = TableTransformerForObjectDetection.from_pretrained("microsoft/table-structure-recognition-v1.1-all")
We define the get_table_features() function that accepts the cropped table image as a parameter and returns the labels, confidence scores, and the bounding box coordinates for the detected rows and columns. The function also prints these values.
def get_table_features(cropped_image):

  # preprocess image input for table transformer
  inputs = image_processor(images = cropped_image, return_tensors="pt")

  # make prediction using table transformer
  outputs = structure_model(**inputs)

  # post process output to Pasval VOC bbox format
  target_sizes = torch.tensor([cropped_image.size[::-1]])
  results = image_processor.post_process_object_detection(outputs, threshold=0.9, target_sizes=target_sizes)[0]

  # define a list to store detected features
  features = []

  # iterate through all the detected features and store feature label, confidence score, and bbox values to cells list
  for i, (score, label, box) in enumerate(zip(results["scores"], results["labels"], results["boxes"])):
      box = [round(i, 2) for i in box.tolist()]
      score = score.item()
      label = structure_model.config.id2label[label.item()]

      cell_dict = {"label":label,
                  "score":score,
                  "bbox":box
                  }


      # print table features
      features.append(cell_dict)
      print(
          f"Detected {label} with confidence "
          f"{round(score, 3)} at location {box}"
      )

  return outputs


features = get_table_features(cropped_image)
Output:
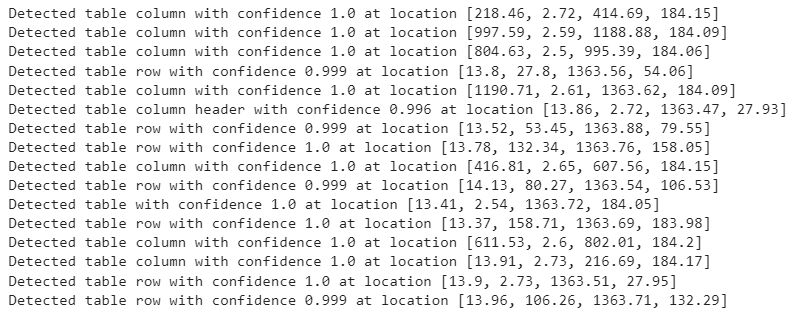
Display Detected features
Next, we define the display_detected_features() function that draws rectangles around detected rows and columns.
def display_detected_features(cropped_image, features):

  cropped_table_visualized = cropped_image.copy()
  draw = ImageDraw.Draw(cropped_table_visualized)

  # increase font size for text labels
  font = ImageFont.truetype("/content/roboto/Roboto-Bold.ttf", 15)

  # iterate through all features and display bounding box with text labels
  for feature in features:
      draw.rectangle(feature["bbox"], outline="red")

      text_position = (feature["bbox"][0], feature["bbox"][1] - 3)

      draw.text(text_position, feature["label"], fill="blue", font = font)

  # return cropped image with bounding box
  return cropped_table_visualized

display_detected_features(cropped_image, features)
Output:
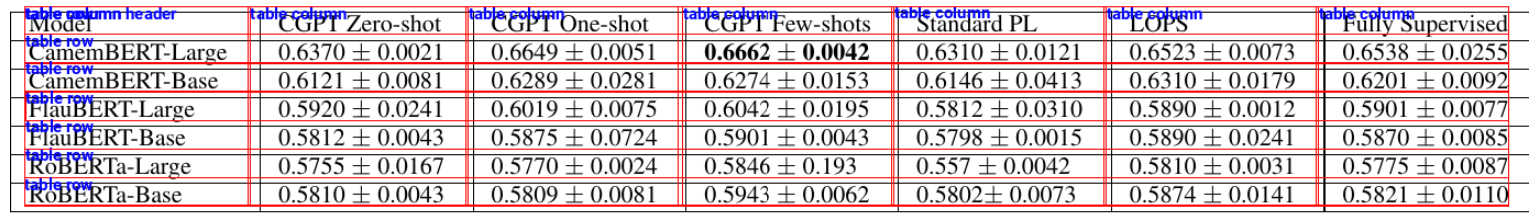
Extract Cell Text Using OCR and Convert to CSV
In the final step, we will detect cell text and convert the detected table to CSV format.
Extract Cells Coordinates
We define the get_cell_coordinates_by_row() function that iterates through the detected rows and extracts column values for each row. The function returns a list of rows where each row contains cell values for all the columns.
def get_cell_coordinates_by_row(table_data):
    # Extract rows and columns
    rows = [entry for entry in table_data if entry['label'] == 'table row']
    columns = [entry for entry in table_data if entry['label'] == 'table column']

    # Sort rows and columns by their Y and X coordinates, respectively
    rows.sort(key=lambda x: x['bbox'][1])
    columns.sort(key=lambda x: x['bbox'][0])

    # Function to find cell coordinates
    def find_cell_coordinates(row, column):
        cell_bbox = [column['bbox'][0], row['bbox'][1], column['bbox'][2], row['bbox'][3]]
        return cell_bbox

    # Generate cell coordinates and count cells in each row
    cell_coordinates = []

    for row in rows:
        row_cells = []
        for column in columns:
            cell_bbox = find_cell_coordinates(row, column)
            row_cells.append({'cell': cell_bbox})

        # Append row information to cell_coordinates
        cell_coordinates.append({'cells': row_cells, 'cell_count': len(row_cells)})


    return cell_coordinates

cell_coordinates = get_cell_coordinates_by_row(features)
Extract Text from Cell Coordinates using OCR
Finally, we define the apply_ocr() function that iterates through all the rows and then applies the PyTesseract OCR to extract cell values for all the columns in a row. The function returns a dictionary where each dictionary value is a list of items corresponding to row cell values from the input table, as you can see in the output of the following script.
def apply_ocr(cell_coordinates, cropped_image):
    # let's OCR row by row
    data = dict()
    max_num_columns = 0
    for idx, row in enumerate(tqdm(cell_coordinates)):
        row_text = []
        for cell in row["cells"]:
            # crop cell out of image
            cell_image = np.array(cropped_image.crop(cell["cell"]))

            # apply OCR using PyTesseract
            text = pytesseract.image_to_string(cell_image, lang='eng', config='--psm 6').strip()
            if text:
                row_text.append(text)


        if len(row_text) > max_num_columns:
            max_num_columns = len(row_text)

        data[idx] = row_text

    print("Max number of columns:", max_num_columns)

    # pad rows which don't have max_num_columns elements
    for row, row_data in data.copy().items():
        if len(row_data) != max_num_columns:
            row_data = row_data + ["" for _ in range(max_num_columns - len(row_data))]
        data[row] = row_data
        print(row_data)

    return data

data = apply_ocr(cell_coordinates, cropped_image)
Output:
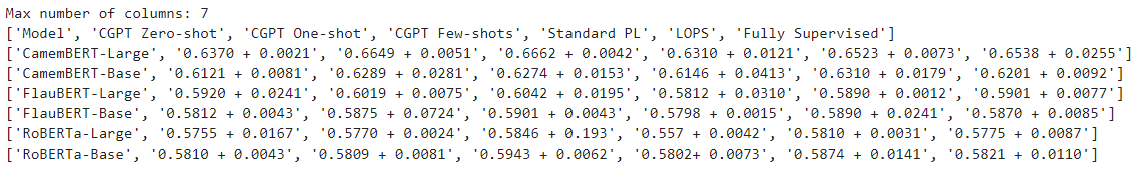
As a last step, we iterate through the table rows data dictionary and write the row values line by line to a CSV file using the csv.writer() method.
def write_csv(data):

  with open('output.csv','w') as result_file:
      wr = csv.writer(result_file, dialect='excel')
      for row, row_text in data.items():

        wr.writerow(row_text)

write_csv(data)

df = pd.read_csv("output.csv")
df
Output:
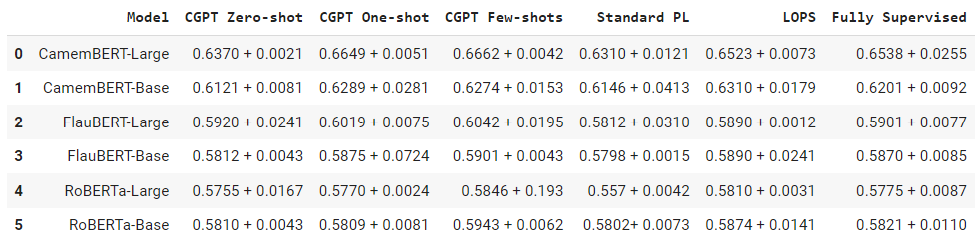
The above output shows the Pandas dataframe containing the data from the generated CSV file.
I hope you liked this tutorial. Feel free to leave your feedback or comments.