Hi,
I am looking to create a Bar Chart based on the values I get from the form.
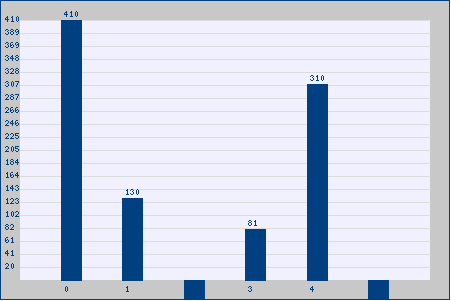
It works with positive values, but at times (since some math are done to find the value) I do have negative values and the graph just shows a bar going down that's it. It won't display values as it displays for positive values.
I am attaching the code, any help would be appreciated!
<?php
    /*Instead of pasting my entire form code I am just assinging values here and stored in array*/

    $a = 410;
	$b = 130;
	$c = -215;
	$d = 81;
	$e = 310;
	$f = -190;
	# ------- The graph values in the form of associative array
	$values=array($a, $b, $c, $d, $e, $f);


	$img_width=450;
	$img_height=300;
	$margins=20;


	# ---- Find the size of graph by substracting the size of borders
	$graph_width=$img_width - $margins * 2;
	$graph_height=$img_height - $margins * 2;
	$img=imagecreate($img_width,$img_height);


	$bar_width=20;
	$total_bars= count($values);
	$gap= ($graph_width- $total_bars * $bar_width ) / ($total_bars +1);


	# -------  Define Colors ----------------
	$bar_color=imagecolorallocate($img,0,64,128);
	$background_color=imagecolorallocate($img,240,240,255);
	$border_color=imagecolorallocate($img,200,200,200);
	$line_color=imagecolorallocate($img,220,220,220);

	# ------ Create the border around the graph ------

	imagefilledrectangle($img,1,1,$img_width-2,$img_height-2,$border_color);
	imagefilledrectangle($img,$margins,$margins,$img_width-1-$margins,$img_height-1-$margins,$background_color);


	# ------- Max value is required to adjust the scale	-------
	$max_value=max($values);
	$ratio= $graph_height/$max_value;


	# -------- Create scale and draw horizontal lines  --------
	$horizontal_lines=20;
	$horizontal_gap=$graph_height/$horizontal_lines;

	for($i=1;$i<=$horizontal_lines;$i++){
		$y=$img_height - $margins - $horizontal_gap * $i ;
		imageline($img,$margins,$y,$img_width-$margins,$y,$line_color);
		$v=intval($horizontal_gap * $i /$ratio);
		imagestring($img,0,5,$y-5,$v,$bar_color);

	}


	# ----------- Draw the bars here ------
	for($i=0;$i< $total_bars; $i++){
		# ------ Extract key and value pair from the current pointer position
		list($key,$value)=each($values);
		$x1= $margins + $gap + $i * ($gap+$bar_width) ;
		$x2= $x1 + $bar_width;
		$y1=$margins +$graph_height- intval($value * $ratio) ;
		$y2=$img_height-$margins;
		imagestring($img,0,$x1+3,$y1-10,$value,$bar_color);
		imagestring($img,0,$x1+3,$img_height-15,$key,$bar_color);
		imagefilledrectangle($img,$x1,$y1,$x2,$y2,$bar_color);
	}
	header("Content-type:image/png");
	imagepng($img);

?>
Also attaching my output. If I understand this then I can create a Bar Chart report for my website.
Thanks!