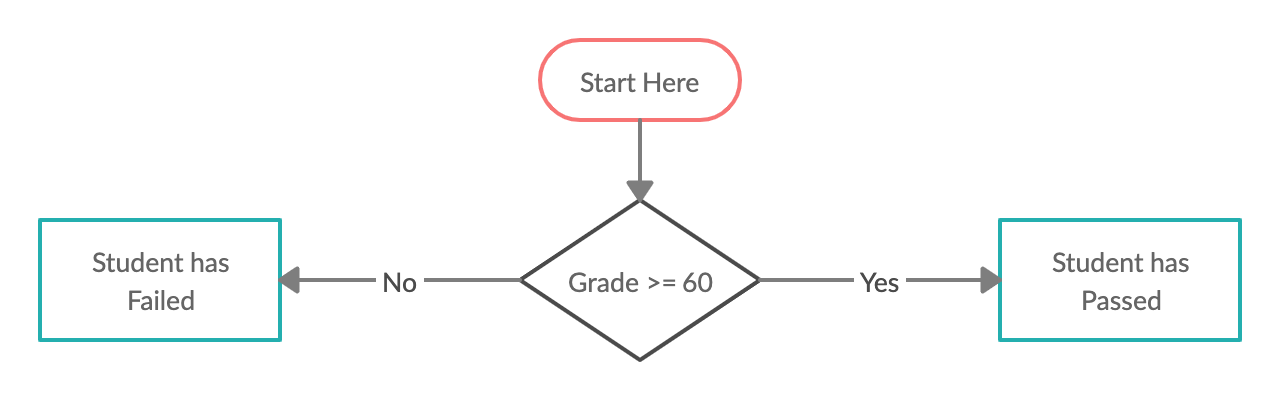
Write an algorithm and draw a flowchart that determine whether a student has passed or failed. Add the student CA,mid semester test and exam score. addition of score should not be more than 100.the pass mark should be 60

Edoburun 0 Newbie Poster
Recommended Answers
Jump to PostHi,
Thanks for submitting your topic. Sorry for it being so difficult to figure out how to do. I'm currently working on trying my best to improve usability here at DaniWeb.
However, per our private chat, please post your question along with what you've tried so far and where you're …
All 4 Replies

Dani 4,675 The Queen of DaniWeb Administrator Featured Poster Premium Member

Reverend Jim 5,259 Hi, I'm Jim, one of DaniWeb's moderators. Moderator Featured Poster
rorock 0 Newbie Poster

james.wilder.9849 0 Newbie Poster
rproffitt commented: Spudacode: Grown in Idaho. +0
Be a part of the DaniWeb community
We're a friendly, industry-focused community of developers, IT pros, digital marketers, and technology enthusiasts meeting, networking, learning, and sharing knowledge.