I'm getting complaints today that the site, API, and chat room are all acting really sluggish and a bit funky. However, I'm not able to reproduce anything out of the ordinary. Can I get specific confirmation, please?

Dani AI

Generated

Several members reported intermittent slowness across the site, API and chat. The most useful follow-up when that happens is a small, consistent diagnostic package that lets staff correlate a client-side observation with server logs and metrics.

Helpful diagnostics to collect (use UTC timestamps in the format YYYY-MM-DD HH:MM:SS UTC): full request path (omit API keys), HTTP method, HTTP status code, exact response time, any request-id or Server-Timing header, browser/OS/ISP, whether the problem affected pages, chat, or API calls, and a HAR (network) export or screenshot of the browser network panel. Short traceroute/ping outputs for the time window are also useful for isolating network vs server issues. Mentions of related posts by and show how valuable a captured HAR or network screenshot can be for correlation.

Quick reproducible timing example (captures server round-trip in one line):

curl -w "status:%{http_code} time_total:%{time_total}s\n" -o /dev/null -s \
  -H "Accept: application/json" \
  "https://www.daniweb.com/api/your-endpoint?params"

For automated clients (for example the DwArticleWatch-style clients discussed here), enable simple instrumentation: record start/end timestamps, log response headers, set sensible timeouts (10s default) and exponential backoff on failures. Minimal Python timing pattern:

import time, requests
t0 = time.time()
r = requests.get(url, timeout=10)
print(r.status_code, "time:", time.time()-t0)

From an admin troubleshooting perspective, correlate the UTC timestamps against slow-query logs, connection-pool exhaustion, CPU/IO and swap activity, long GC pauses, background jobs (indexing/backups) and CDN cache invalidations. When posting diagnostics publicly, never include API tokens or credentials. For future resilience, add synthetic monitors and request tracing with propagated request-ids so intermittent incidents can be diagnosed without user-side guesswork.

Recommended Answers

All 7 Replies

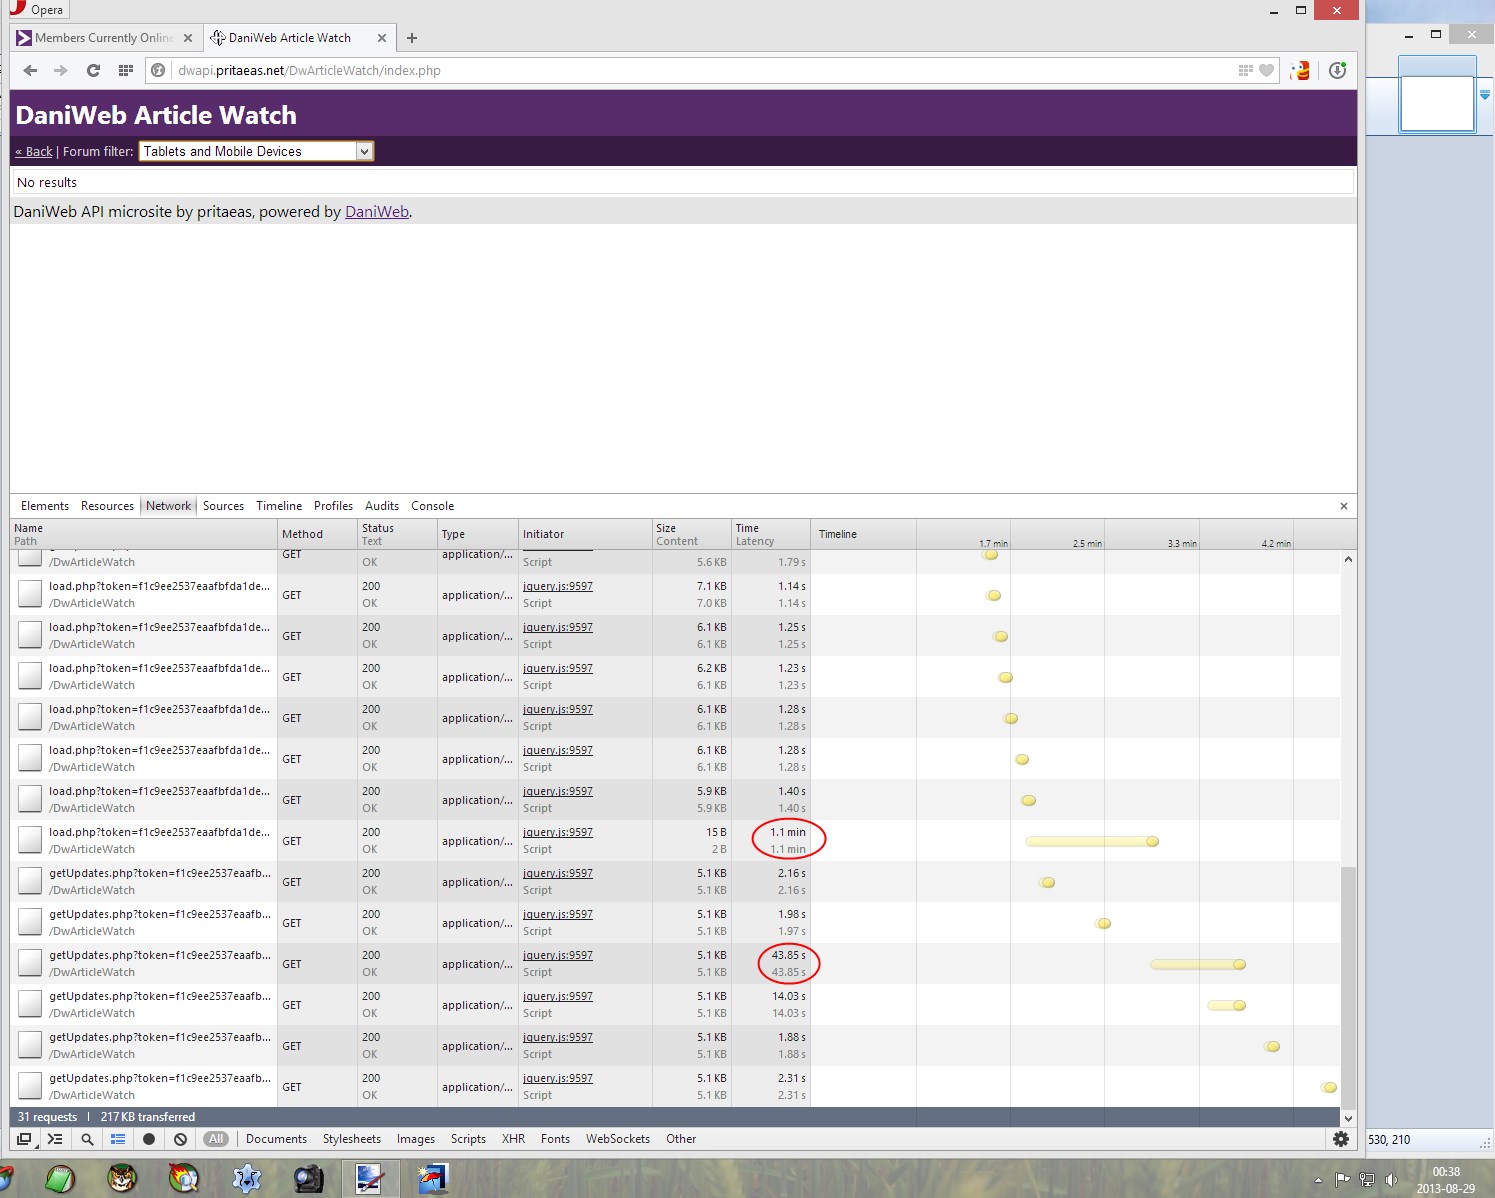
Network inspection screenshot attached. Taken while running my DwArticleWatch API client. Default response always was below 2 secs.

After hounding James that the issue isn't on my end, he finally found the server issue causing the problems!! :)

I'm personally having my own internet issues atm, which is making this take a little bit longer to fix. /sigh

I was getting some funky problems earlier today, but nothing at the moment. For example when I clicked on menu Geek's Lounge it would time out and return an error. But that was about 12 hours or so ago. No recent probleds.

yes, it was fixed about 10 minutes after I posted :)

Seems fine here.

Be a part of the DaniWeb community

We're a friendly, industry-focused community of developers, IT pros, digital marketers, and technology enthusiasts meeting, networking, learning, and sharing knowledge.