I'm writing this to let you know that I've found "bug" in the Dashboard widget iStat. It's not a bug per se, but you should know about it.

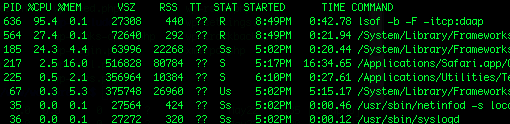
iStat offers many statistics about your Mac -- amount of time running since reboot, temperature, fan speed, etc, etc. However, if you choose the option of listing currently running processes in iStat, after a few seconds, it starts the program lsof. This program sucks up about 98% of your CPU cycles, so your Mac might be slower. (It also might not, but of course running your CPU more than you need to is a waste of heat and power, especially on a laptop.) Quiting iStat does not quit lsof, however, so the process will keep running until either your reboot, or you quit it manually with the Unix tool kill.

iStat shows the process lsof only some of the time. I monitored it using ps -aux. Below you can see what lsof is doing to my cpu after I listed processes with iStat. My fans on my MacBook are getting louder and louder as I type this, and pretty soon I'll have to reboot.....

Oh any by the way iStat temperature monitor and fan speed doesn't work on MacBooks.

You have been warned!
Dani AI

Generated

's observation that enabling iStat's process‑list can launch an lsof helper that hogs CPU and remain running after the widget quits explains the loud fans and slowdowns reported here. That kind of runaway helper is worth treating as a real resource bug on laptops.

Activity Monitor (Applications > Utilities) is the safest way to confirm which process is consuming CPU; the lsof entry can be stopped with Quit Process → Force Quit. Preventive steps that avoid repetition are: turn off the widget's process‑listing option or remove the widget from Dashboard, and then end the orphaned helper by logging out or restarting the GUI session (a reboot also clears it). Updating iStat to a later build or removing the widget entirely removes the attack surface.

This also supports 's point about Dashboard: widgets only become active after the first launch and can increase RAM/CPU usage on older or low‑RAM machines, so minimizing active widgets or disabling Dashboard on such systems reduces background load. The note about temperature/fan reporting not working on some MacBooks is consistent with limited sensor access on older models and is not unusual.

If the issue can be reproduced, collecting an Activity Monitor sample and Console log and reporting the exact steps to the widget author will help get a fix. For low‑overhead monitoring, prefer Activity Monitor or lightweight menu‑bar tools that do not spawn persistent external helpers.

Recommended Answers

All 4 Replies

i think i speak for everone when i say: who cares.

i think i speak for everone when i say: who cares.

It's a lot to care about if you're running iStat. Come on, 98% of your CPU usage? That's as bad as a virus (or spyware). If you don't care, then just don't post here. But I think it's important, because people do use iStat. And they deserve to know about it.

TheNNS-

Watch yourself, that's all I have to say...

Yeah there are a number of other options that use much less CPU power even though iStat claims they use the least. The Dashboard in general eats up a decent amount of RAM once it's launched for the first time after each reboot/startup (until then the Dashboard items are not active). Disabling the Dashboard on older machines or machines without a lot of RAM can help a bit.

Be a part of the DaniWeb community

We're a friendly, industry-focused community of developers, IT pros, digital marketers, and technology enthusiasts meeting, networking, learning, and sharing knowledge.