
Hi there,
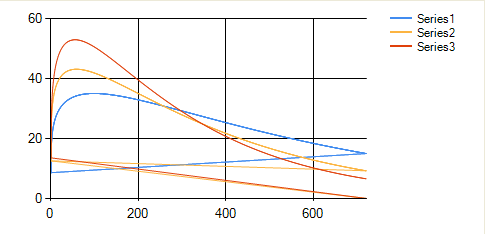
I want to picture a line graph based on my array. I can create a graph line with 3 different series, but I don't get my exact chart as in excel. As can be seen from graph in the attachment. It has additional lines. I want just the 3 curved lines, but i don't know why it create other lines. Here is the code I used:
ReDim dataGraph(2, UPPER + 1)
      Chart1.Series.Add("Series1")
      Chart1.Series.Add("Series2")
      Chart1.Series.Add("Series3")
      'eachpart is the result of multiple statistical calculation
      dataGraph(LL - 1, TT) = eachpart  'TT is the counter in a for loop
      Chart1.Series("Series1").Points.AddXY(TT, dataGraph(0, TT))
      Chart1.Series("Series2").Points.AddXY(TT, dataGraph(1, TT))
      Chart1.Series("Series3").Points.AddXY(TT, dataGraph(2, TT))
      'to picture all series
      Chart1.Series("Series1").ChartType = SeriesChartType.Line
      Chart1.Series("Series2").ChartType = SeriesChartType.Line
      Chart1.Series("Series3").ChartType = SeriesChartType.Line
What is wrong with this code?
Thanks for your help