I'm not quite sure what happened, but at some point fairly recently, Chrome DevTools stopped showing things in the Console.

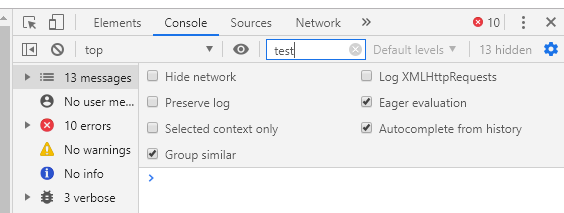
As a web developer, I obviously frequently use this to debug Javascript. Now, instead, there will be a little red circle with an error count in the top right corner of the DevTools window (as always), so it will recognize when there's an error, but the Console will be empty instead of spitting out what's wrong.

Even if I do console.log('foo'); from within a Javascript file, it won't write to the console.

I'm using what's currently the latest version of Chrome, Version 74.0.3729.169 (Official Build) (64-bit).

Help much appreciated as I don't like Firefox or Safari, but not having access to the Console is not sustainable.

Recommended Answers

All 4 Replies

I just want to comment that I have it set to show Errors, Warnings, Info, and Verbose, so everything. I also have Log XMLHttpRequests checked.

commented: so, have you fixed it ? +0

This is a stretch since it seems to work here. So here's an example with a goof on my part.
floot.PNG
I have something in the search box but to the right of "test" is "13 hidden". Also in this shot I show the console sidebar.
Clear the search box and I get a display of the hidden items.

There's some chat about console.log() not logging when the "code snippet was attempting to grab the scrolling area" which was nothing I've ever tried. Wish I had more to offer but console.log() is working here on W10 Chrome Version 74.0.3729.169 (Official Build) (64-bit).

OMG! I had a filter int he text box! That was it. How crazy.

This is on one of those "once you see it." I hesitated but decided, hey, share a goof that lost me a day. Thanks for the update.

Be a part of the DaniWeb community

We're a friendly, industry-focused community of developers, IT pros, digital marketers, and technology enthusiasts meeting, networking, learning, and sharing knowledge.